Explore Australian Government prescription expenditure by financial year, quarter and medicine.
Based on official PBS and RPBS Date of Supply data.
Verify significant findings against the official PBS Date of Supply data and explanatory notes.
| Financial Year | Government Contribution Dollars | Prescriptions |
|---|---|---|
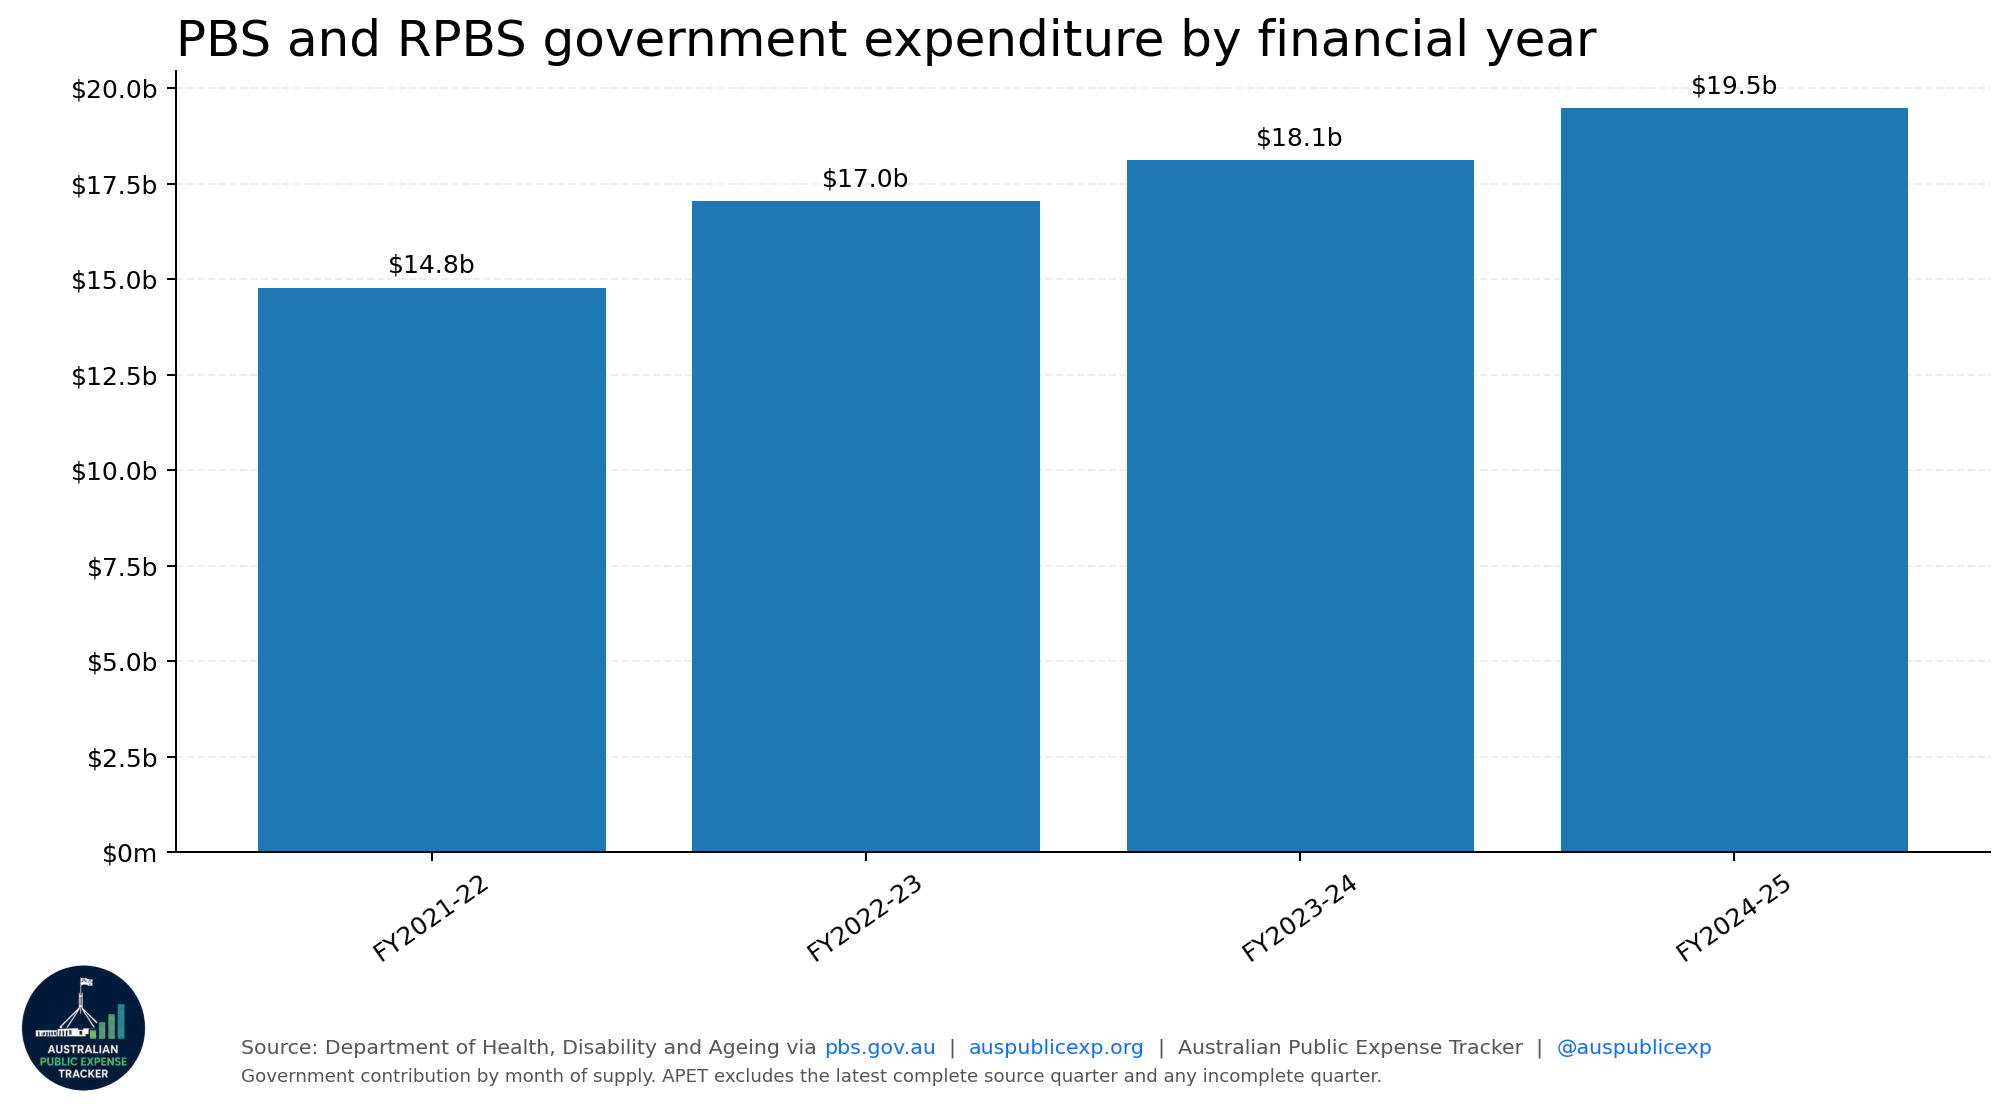
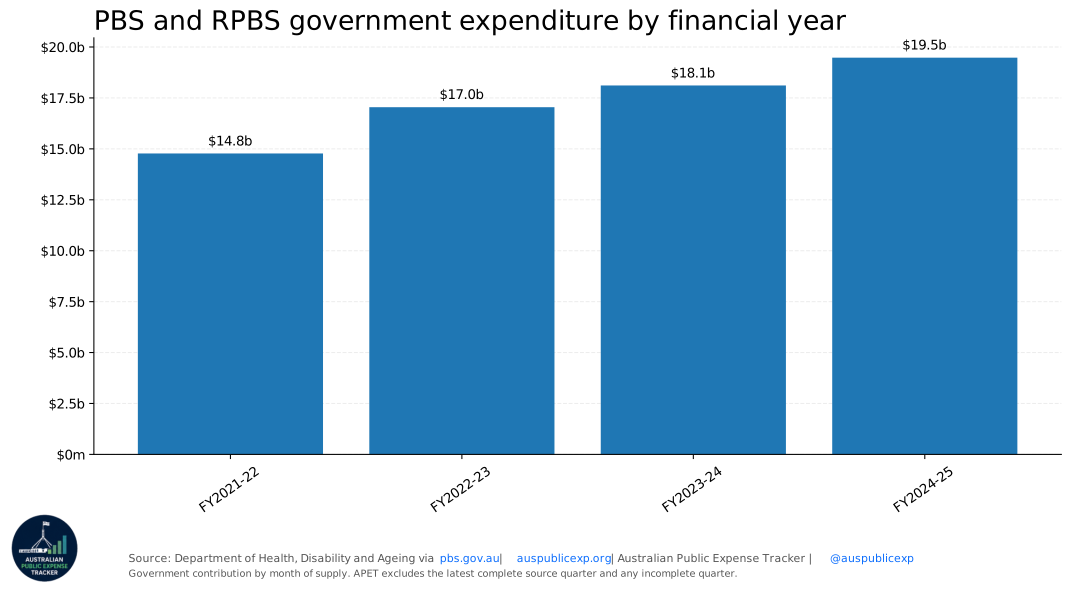
| FY2021-22 | $14,773,568,888 | 323,170,130 |
| FY2022-23 | $17,044,737,720 | 335,875,330 |
| FY2023-24 | $18,111,454,280 | 339,574,620 |
| FY2024-25 | $19,476,641,683 | 335,117,433 |
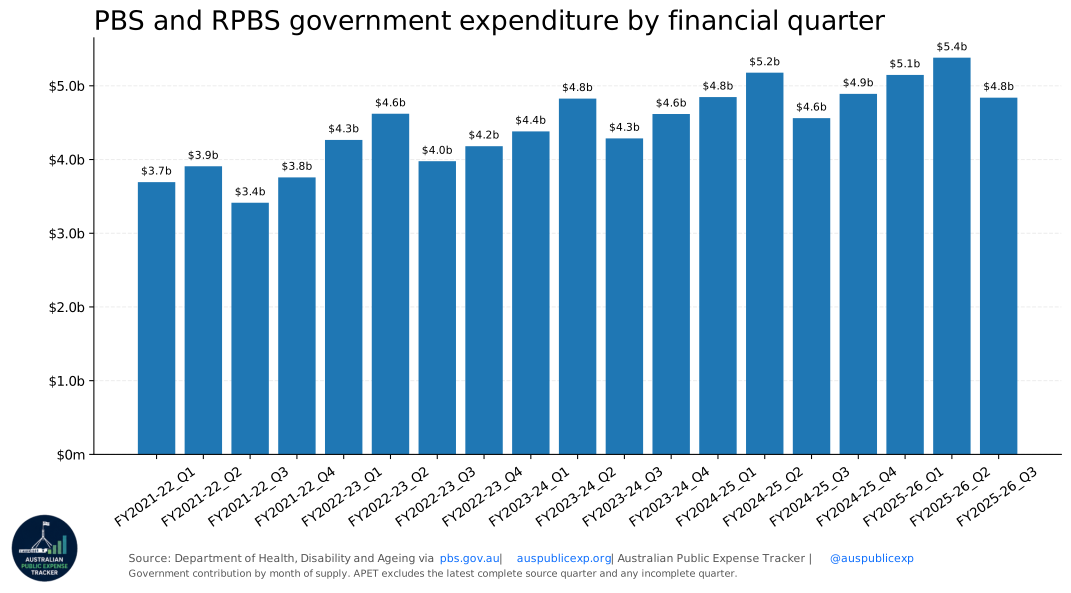
| Financial Quarter | Government Contribution Dollars | Prescriptions |
|---|---|---|
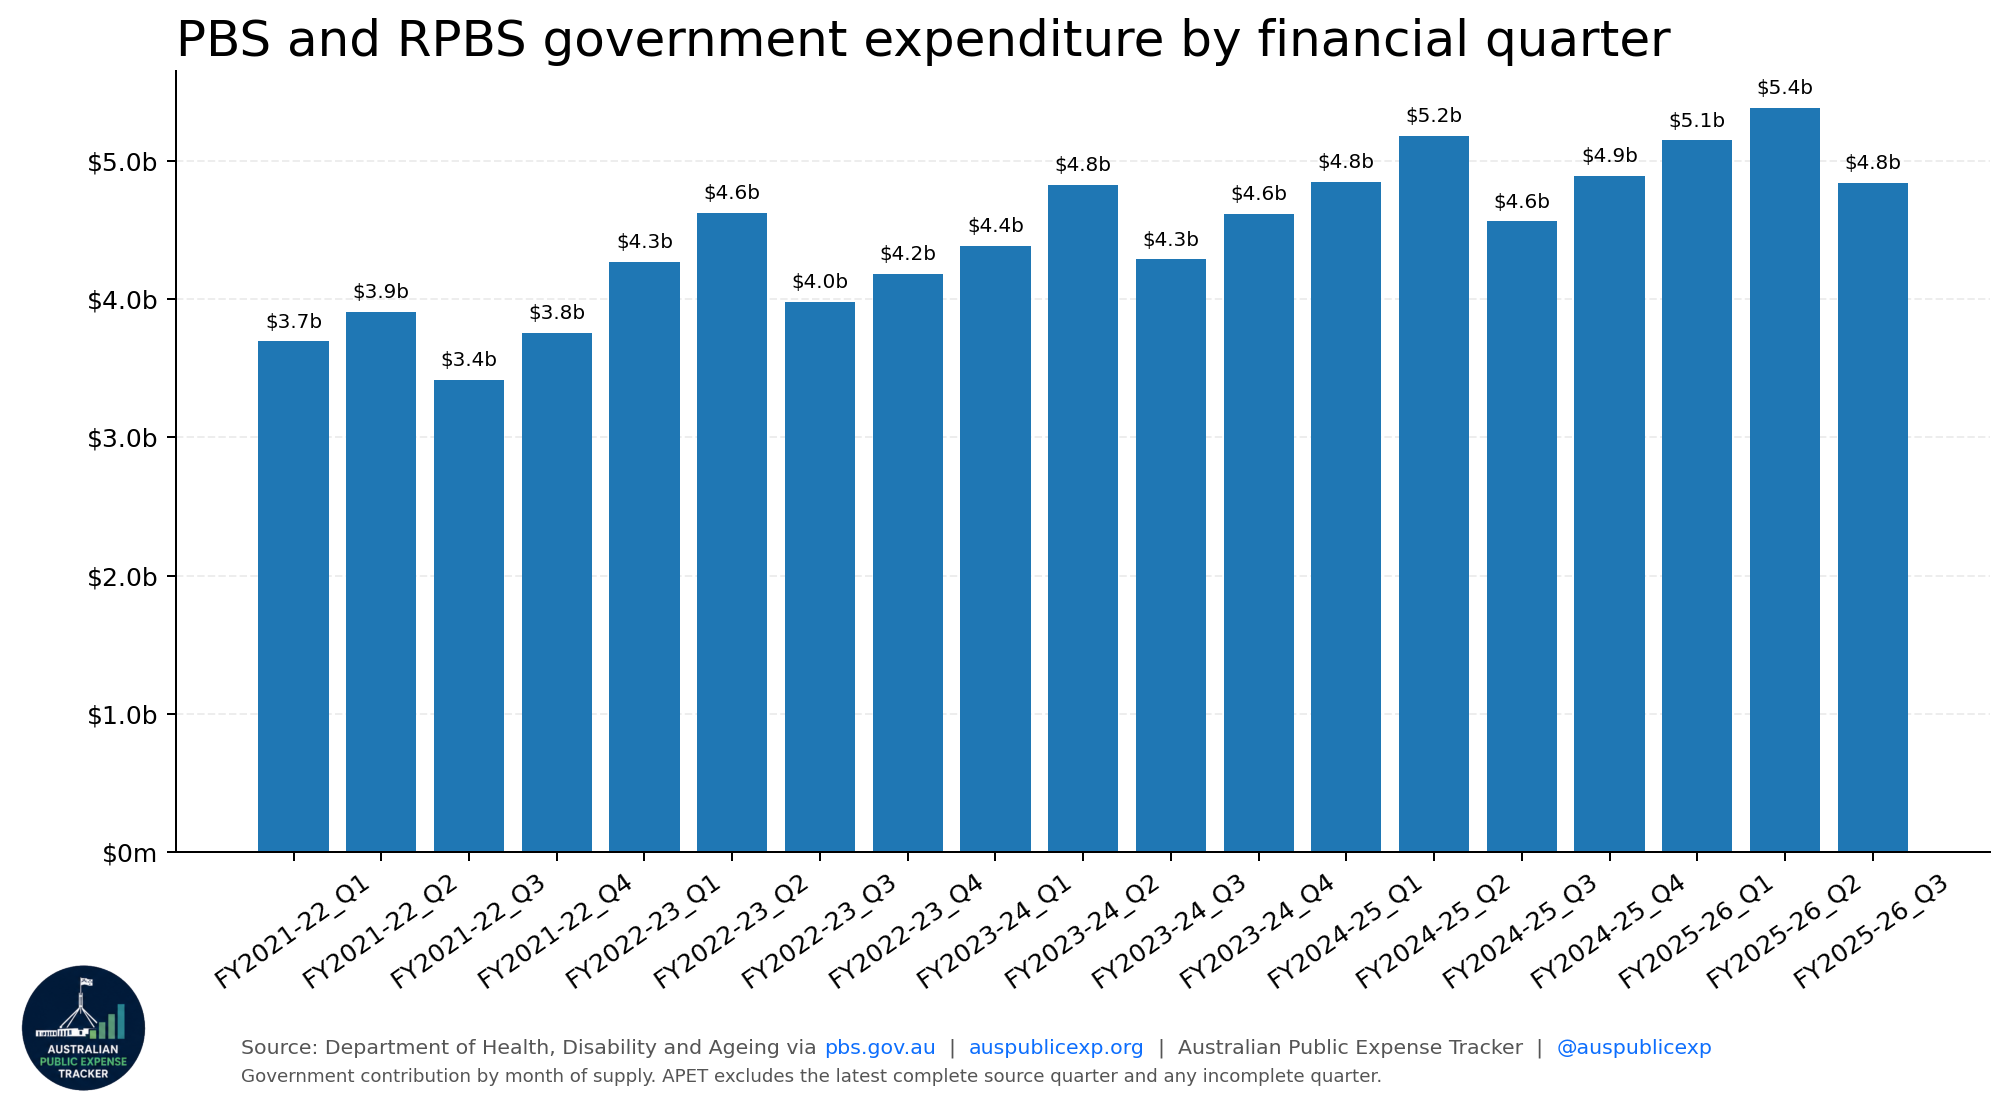
| FY2021-22_Q1 | $3,693,537,484 | 81,821,235 |
| FY2021-22_Q2 | $3,908,839,878 | 84,520,627 |
| FY2021-22_Q3 | $3,413,934,065 | 75,482,461 |
| FY2021-22_Q4 | $3,757,257,461 | 81,345,807 |
| FY2022-23_Q1 | $4,265,966,552 | 85,274,625 |
| FY2022-23_Q2 | $4,620,759,378 | 88,463,522 |
| FY2022-23_Q3 | $3,976,998,814 | 78,068,240 |
| FY2022-23_Q4 | $4,181,012,976 | 84,068,943 |
| FY2023-24_Q1 | $4,381,470,565 | 87,031,136 |
| FY2023-24_Q2 | $4,825,869,333 | 89,205,147 |
| FY2023-24_Q3 | $4,286,500,464 | 79,047,824 |
| FY2023-24_Q4 | $4,617,613,918 | 84,290,513 |
| FY2024-25_Q1 | $4,847,250,970 | 86,451,770 |
| FY2024-25_Q2 | $5,177,736,039 | 88,195,644 |
| FY2024-25_Q3 | $4,560,981,132 | 77,498,775 |
| FY2024-25_Q4 | $4,890,673,542 | 82,971,244 |
| FY2025-26_Q1 | $5,147,571,465 | 86,268,009 |
| FY2025-26_Q2 | $5,381,246,308 | 88,991,928 |
| FY2025-26_Q3 | $4,839,236,882 | 79,491,772 |
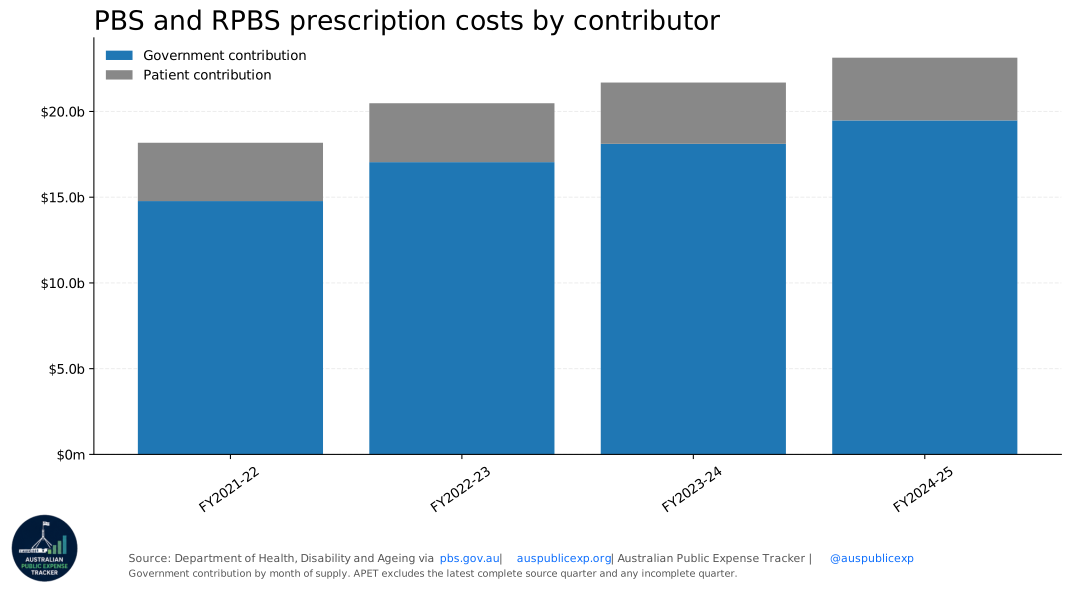
| Financial Year | Government Contribution Dollars | Patient Contribution Dollars |
|---|---|---|
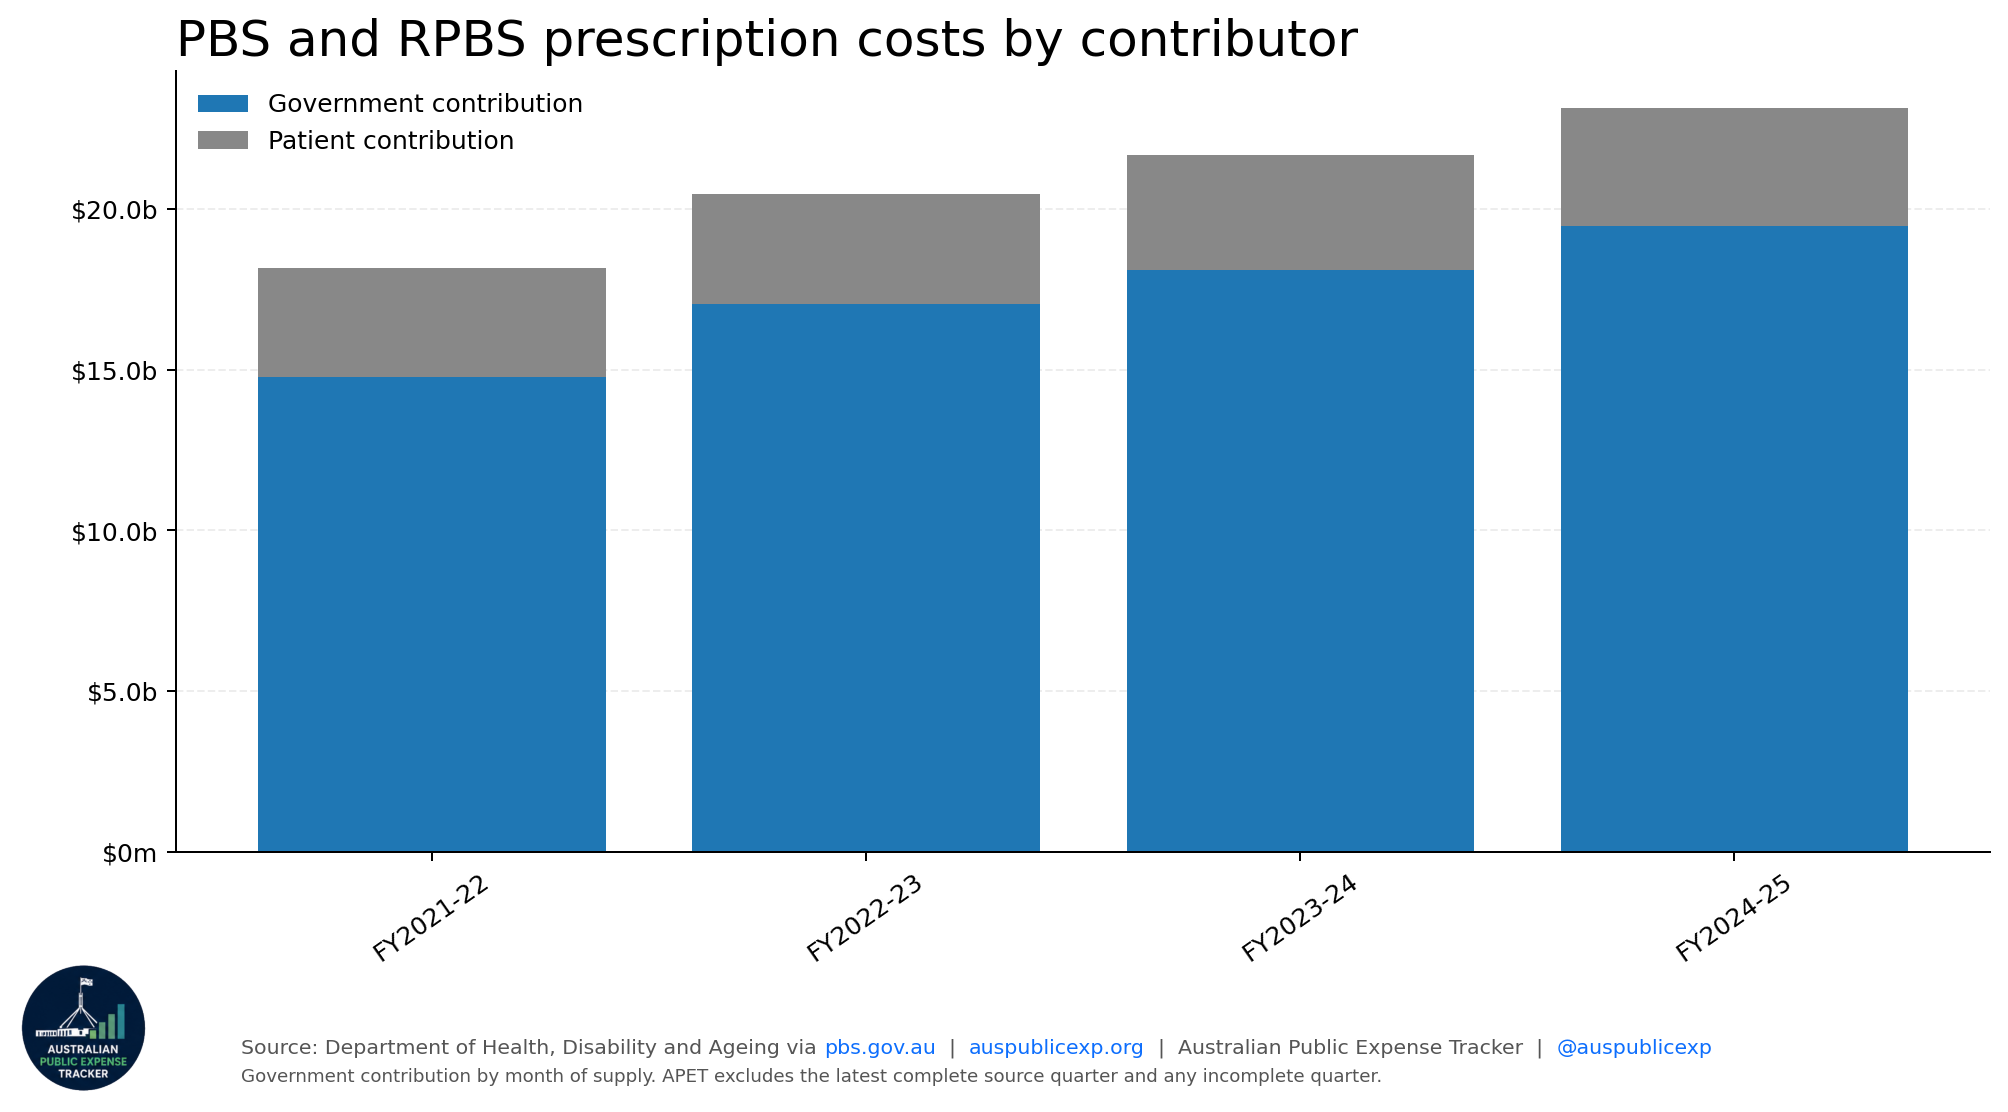
| FY2021-22 | $14,773,568,888 | $3,400,678,750 |
| FY2022-23 | $17,044,737,720 | $3,434,187,492 |
| FY2023-24 | $18,111,454,280 | $3,574,578,303 |
| FY2024-25 | $19,476,641,683 | $3,658,540,708 |
Complete Australian financial years only.
Published with a one-complete-quarter lag.