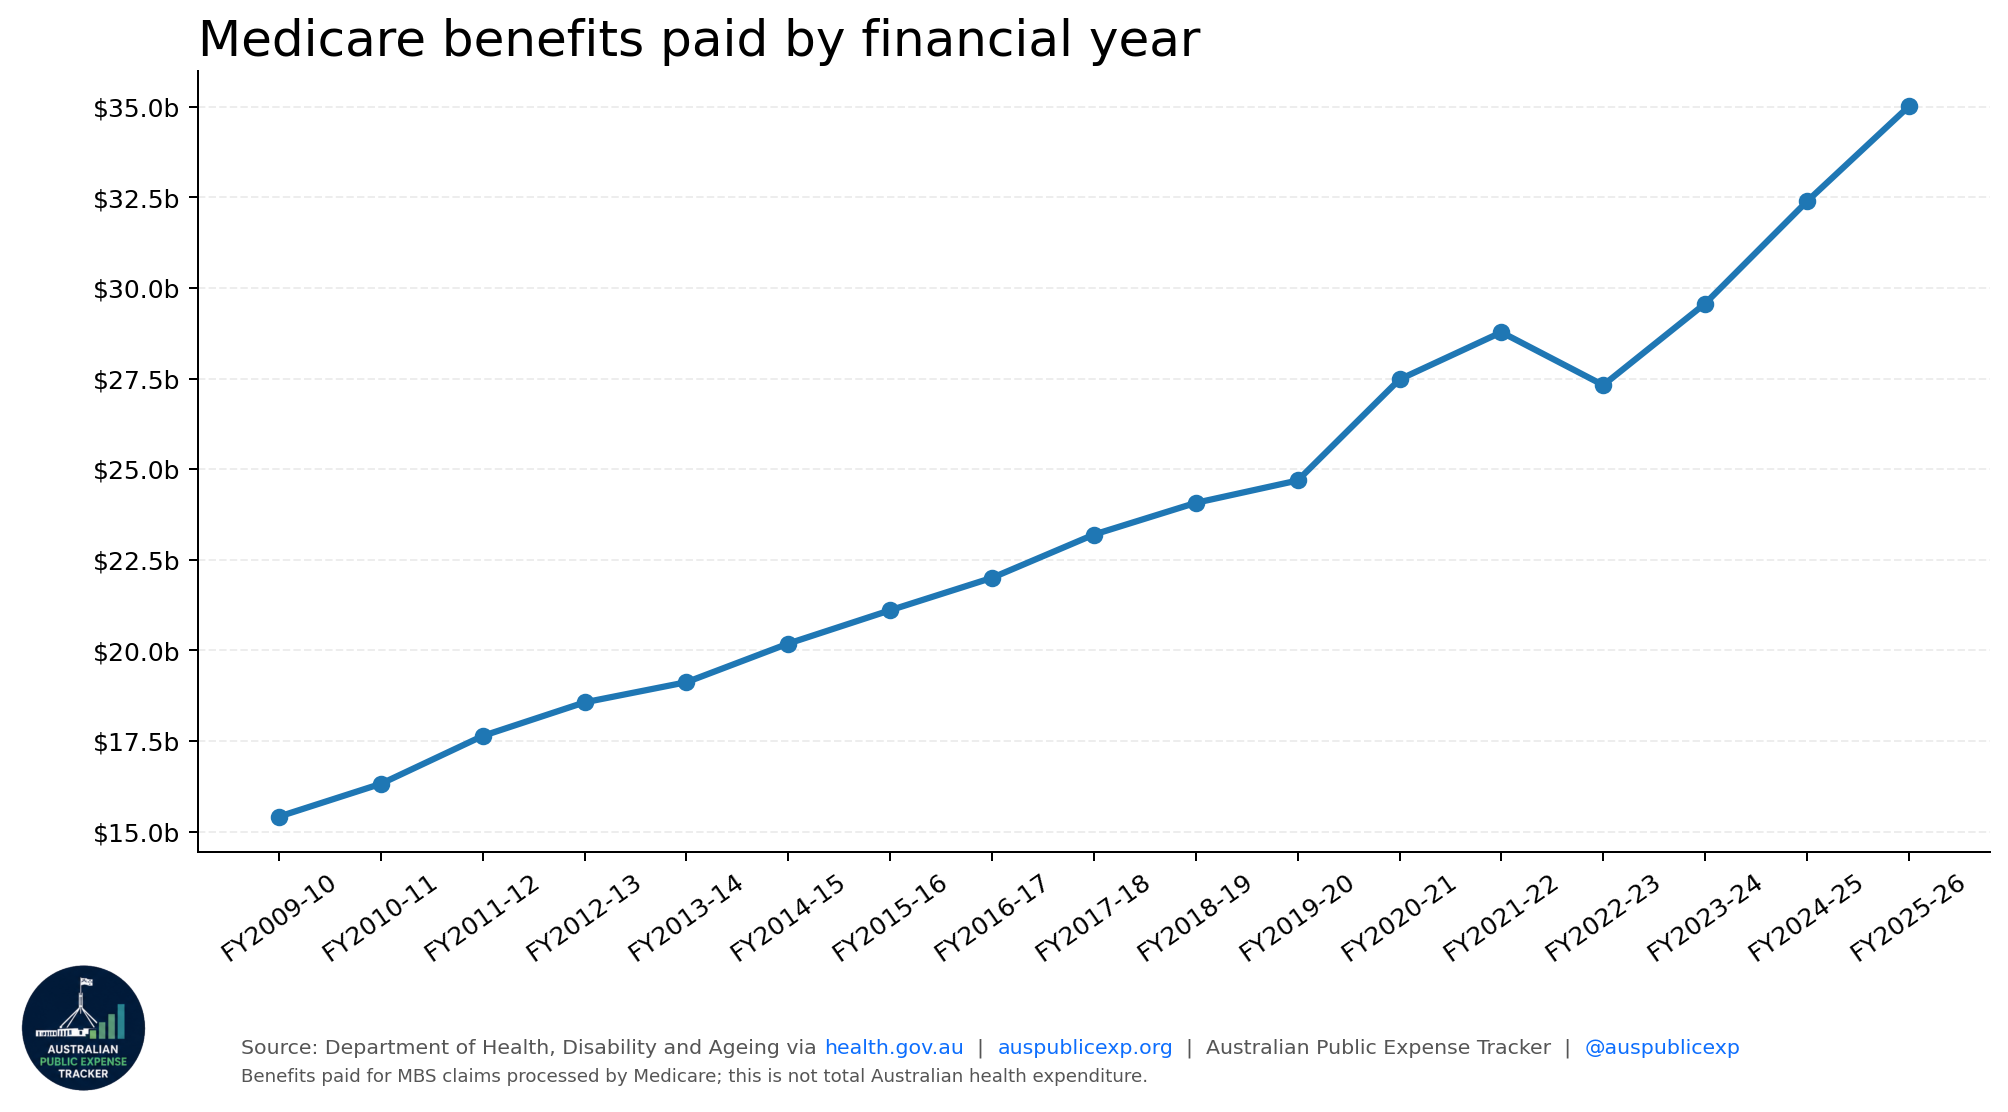
Explore Australian Government Medicare benefits paid by financial year, quarter, service type and patient location.
Based on official quarterly Medicare statistics published by the Department of Health, Disability and Ageing.
Verify significant findings against the official Medicare statistics and explanatory notes.
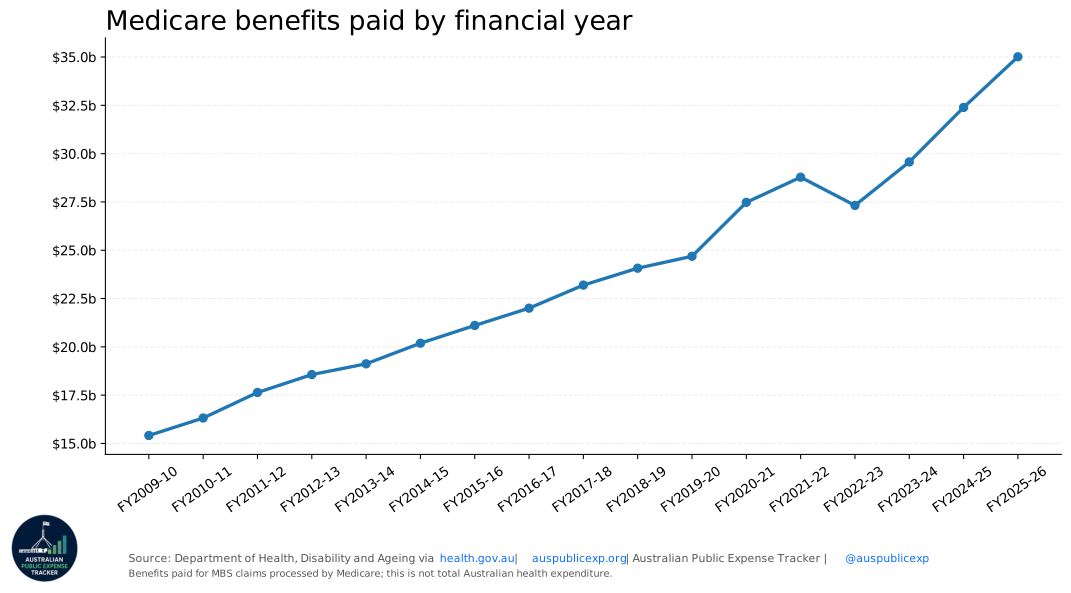
| Financial Year | Benefits Dollars | Services |
|---|---|---|
| FY2009-10 | $15,413,724,461 | 307,966,183 |
| FY2010-11 | $16,317,613,308 | 318,741,838 |
| FY2011-12 | $17,639,224,818 | 332,228,657 |
| FY2012-13 | $18,565,612,025 | 343,585,542 |
| FY2013-14 | $19,122,555,807 | 356,119,113 |
| FY2014-15 | $20,188,930,934 | 368,470,849 |
| FY2015-16 | $21,107,789,068 | 384,024,318 |
| FY2016-17 | $22,002,575,716 | 394,256,280 |
| FY2017-18 | $23,196,401,404 | 414,312,581 |
| FY2018-19 | $24,071,446,217 | 424,193,963 |
| FY2019-20 | $24,688,411,519 | 428,289,342 |
| FY2020-21 | $27,477,859,459 | 465,866,621 |
| FY2021-22 | $28,780,243,163 | 506,839,371 |
| FY2022-23 | $27,320,413,878 | 454,388,195 |
| FY2023-24 | $29,571,018,531 | 459,487,912 |
| FY2024-25 | $32,391,033,048 | 475,211,313 |
| FY2025-26 | $35,012,508,052 | 482,482,833 |
Complete Australian financial years, newest first.
Official financial-quarter results, newest first.