
NDIS payments in charts
Where payments go and how they changed across three financial years.
1 July 2023 – 30 June 2026. Each year uses its June snapshot. Amounts are Australian dollars, not adjusted for inflation.
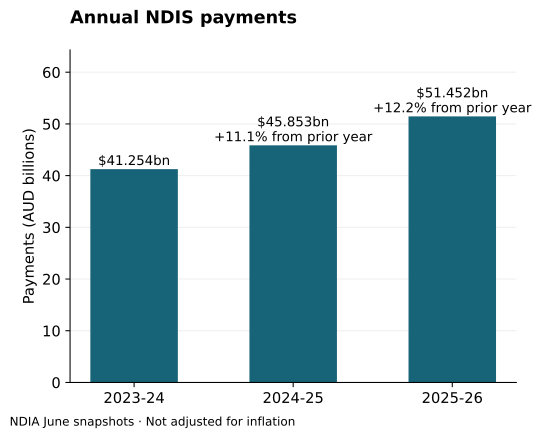
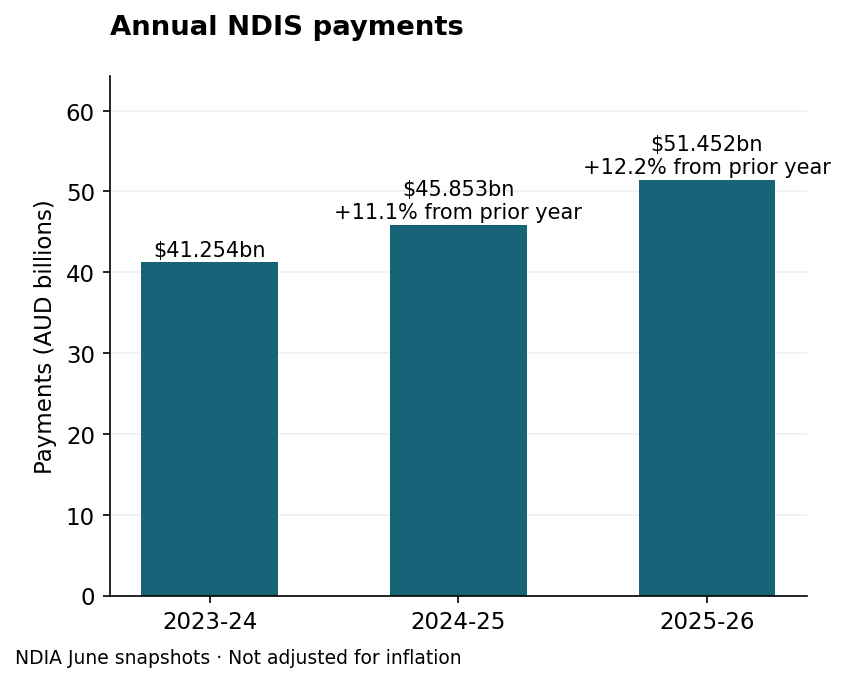
Annual NDIS payments
National payment totals, with percentage changes from the preceding financial year. The vertical scale starts at zero.
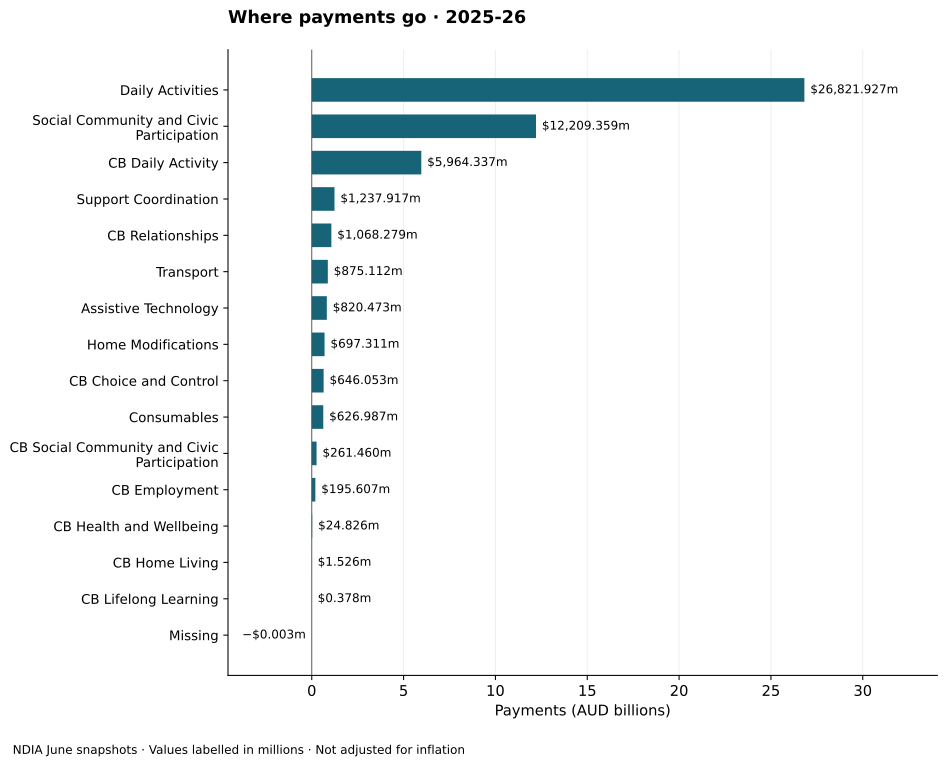
Where payments go · 2025-26
Support categories ranked by payments. “CB” means Capacity Building. Chart labels are in millions; the horizontal axis is in billions.
On a small screen, swipe the chart sideways or open the exact-values table.
View exact values: Where payments go · 2025-26
| Financial Year | Support Category | Payments Aud |
|---|---|---|
| 2025-26 | Assistive Technology | $820,473,000 |
| 2025-26 | CB Choice and Control | $646,053,000 |
| 2025-26 | CB Daily Activity | $5,964,337,000 |
| 2025-26 | CB Employment | $195,607,000 |
| 2025-26 | CB Health and Wellbeing | $24,826,000 |
| 2025-26 | CB Home Living | $1,526,000 |
| 2025-26 | CB Lifelong Learning | $378,000 |
| 2025-26 | CB Relationships | $1,068,279,000 |
| 2025-26 | CB Social Community and Civic Participation | $261,460,000 |
| 2025-26 | Consumables | $626,987,000 |
| 2025-26 | Daily Activities | $26,821,927,000 |
| 2025-26 | Home Modifications | $697,311,000 |
| 2025-26 | Missing | −$3,000 |
| 2025-26 | Social Community and Civic Participation | $12,209,359,000 |
| 2025-26 | Support Coordination | $1,237,917,000 |
| 2025-26 | Transport | $875,112,000 |
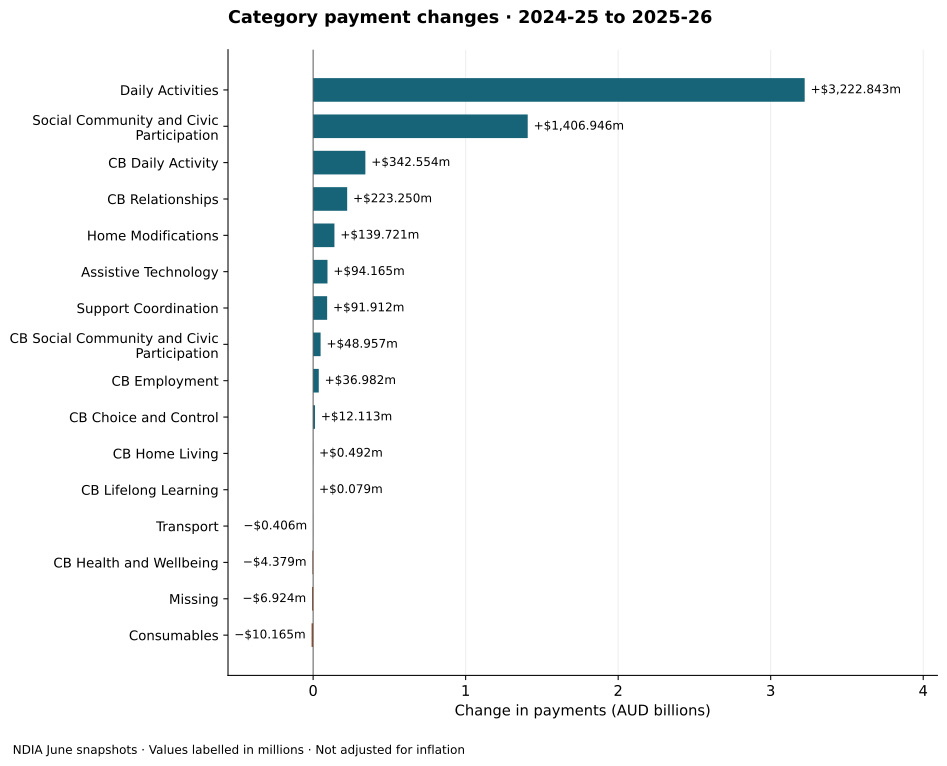
Which categories account for the increase?
2024–25 to 2025–26. Each bar is the later year minus the earlier year. Bars to the right show increases; bars to the left show decreases. This describes where changes occurred, without establishing their causes.
View exact values: Category payment changes · 2024-25 to 2025-26
| From Financial Year | To Financial Year | Support Category | From Payments Aud | To Payments Aud | Change Aud |
|---|---|---|---|---|---|
| 2024-25 | 2025-26 | Assistive Technology | $726,308,000 | $820,473,000 | $94,165,000 |
| 2024-25 | 2025-26 | CB Choice and Control | $633,940,000 | $646,053,000 | $12,113,000 |
| 2024-25 | 2025-26 | CB Daily Activity | $5,621,783,000 | $5,964,337,000 | $342,554,000 |
| 2024-25 | 2025-26 | CB Employment | $158,625,000 | $195,607,000 | $36,982,000 |
| 2024-25 | 2025-26 | CB Health and Wellbeing | $29,205,000 | $24,826,000 | −$4,379,000 |
| 2024-25 | 2025-26 | CB Home Living | $1,034,000 | $1,526,000 | $492,000 |
| 2024-25 | 2025-26 | CB Lifelong Learning | $299,000 | $378,000 | $79,000 |
| 2024-25 | 2025-26 | CB Relationships | $845,029,000 | $1,068,279,000 | $223,250,000 |
| 2024-25 | 2025-26 | CB Social Community and Civic Participation | $212,503,000 | $261,460,000 | $48,957,000 |
| 2024-25 | 2025-26 | Consumables | $637,152,000 | $626,987,000 | −$10,165,000 |
| 2024-25 | 2025-26 | Daily Activities | $23,599,084,000 | $26,821,927,000 | $3,222,843,000 |
| 2024-25 | 2025-26 | Home Modifications | $557,590,000 | $697,311,000 | $139,721,000 |
| 2024-25 | 2025-26 | Missing | $6,921,000 | −$3,000 | −$6,924,000 |
| 2024-25 | 2025-26 | Social Community and Civic Participation | $10,802,413,000 | $12,209,359,000 | $1,406,946,000 |
| 2024-25 | 2025-26 | Support Coordination | $1,146,005,000 | $1,237,917,000 | $91,912,000 |
| 2024-25 | 2025-26 | Transport | $875,518,000 | $875,112,000 | −$406,000 |
Category sums differ slightly from the national support-class totals in the source. Changes here use category values consistently and may not add exactly to the change in the national total. “Missing” is retained as a source category, including the negative entry in 2025–26.
State and territory trends
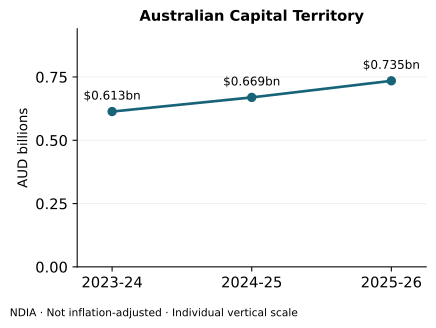
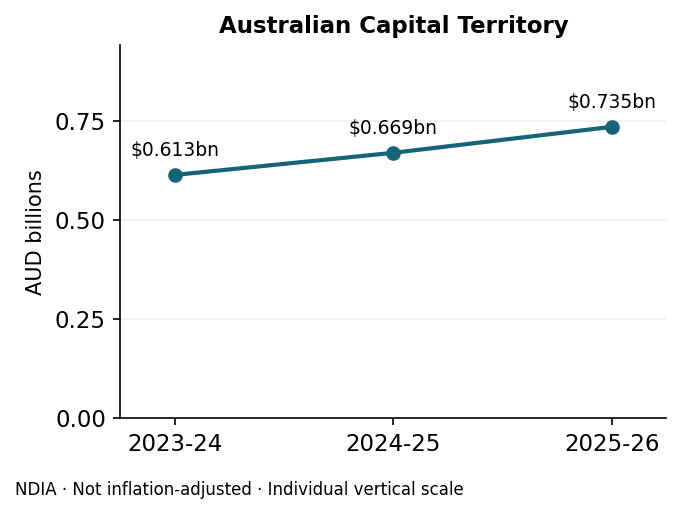
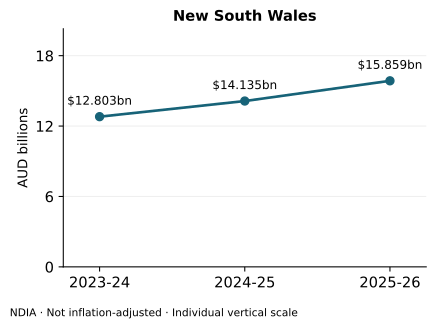
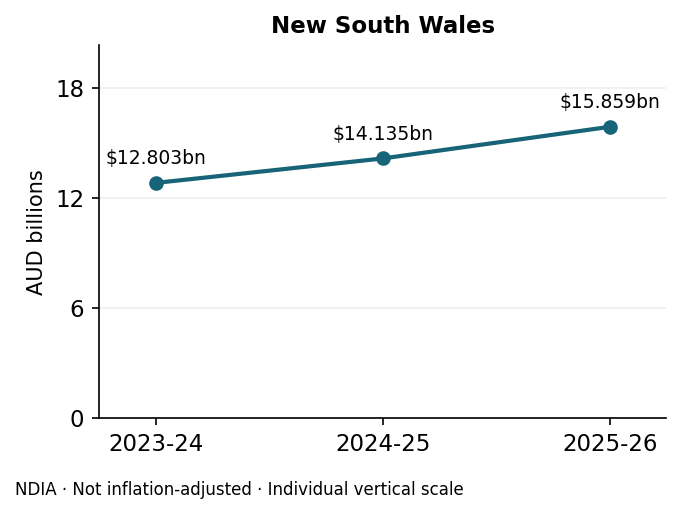
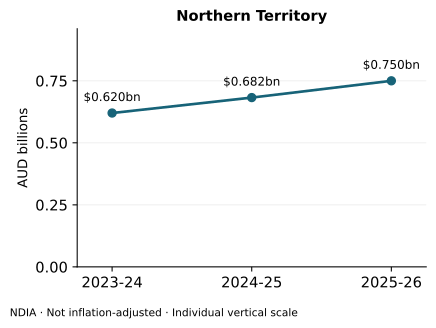
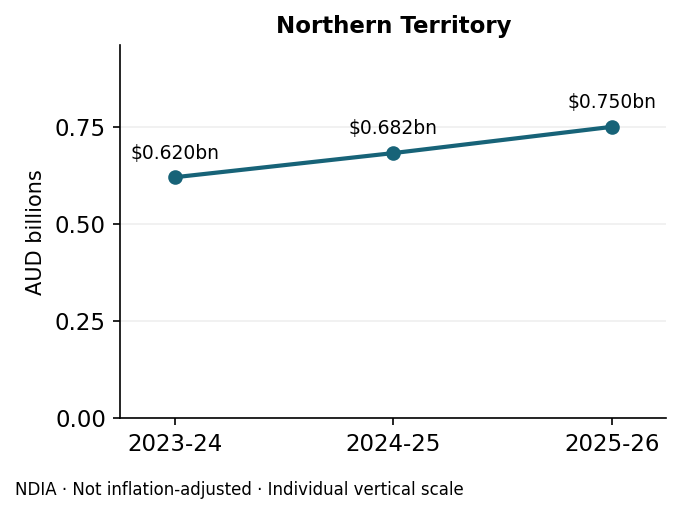
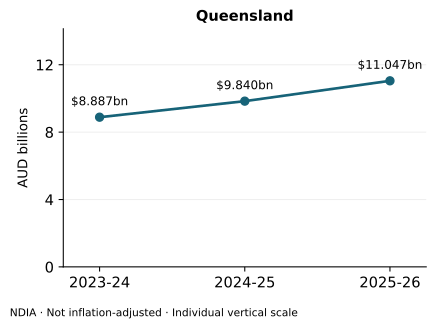
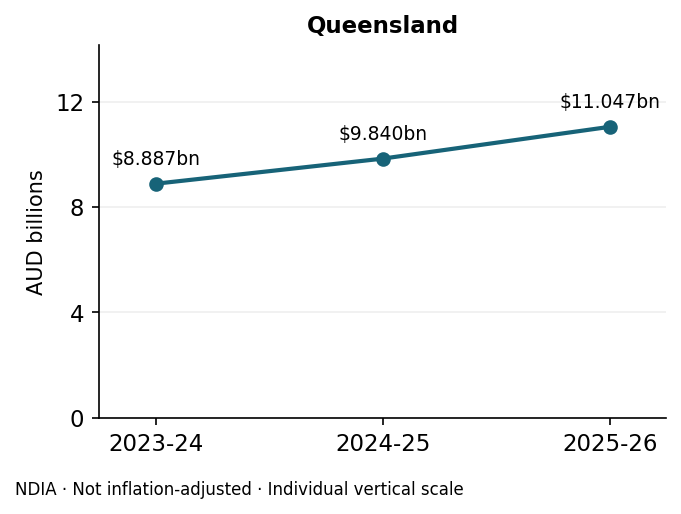
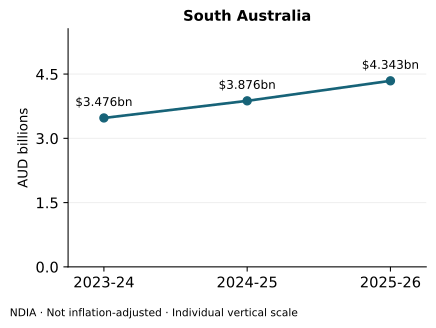
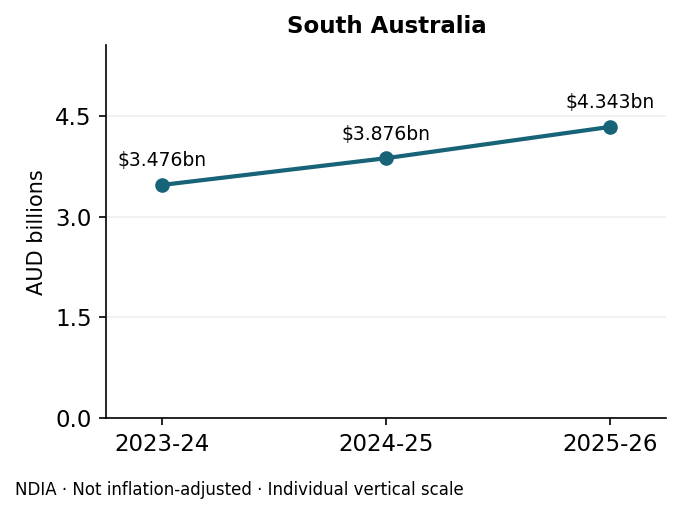
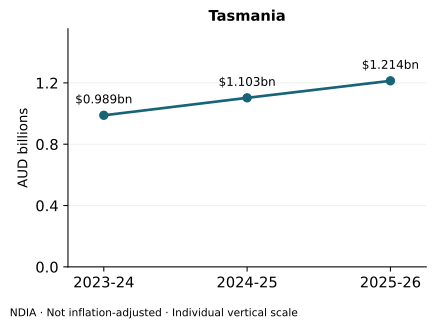
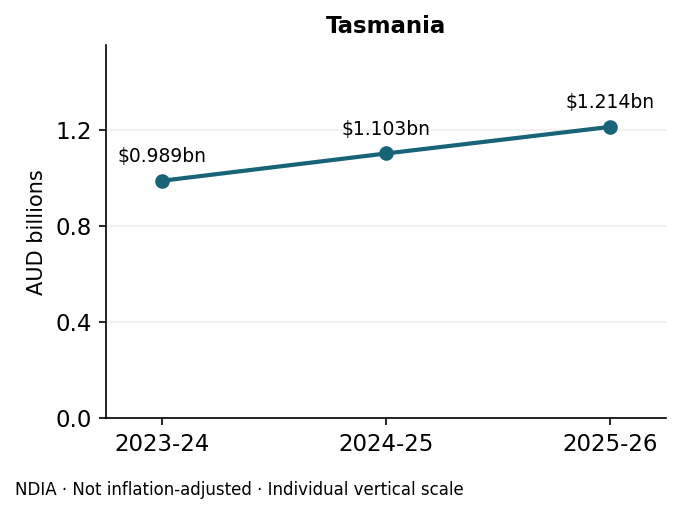
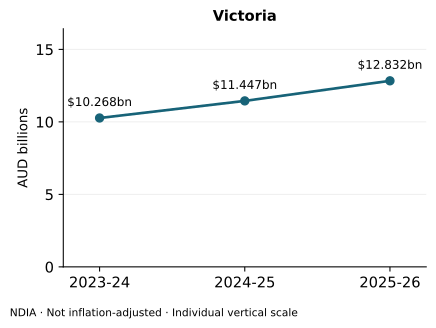
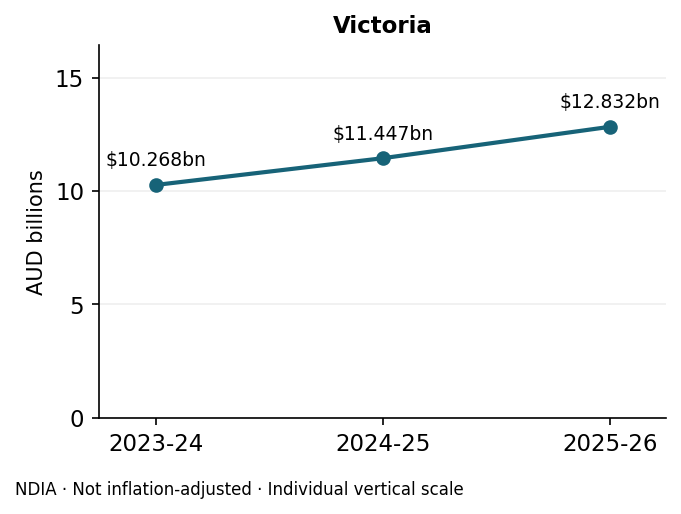
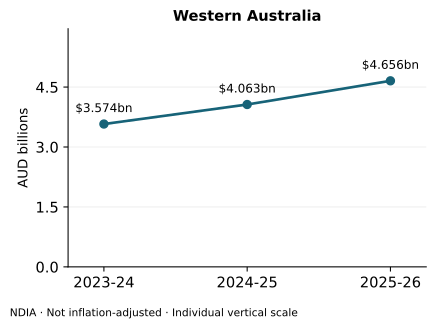
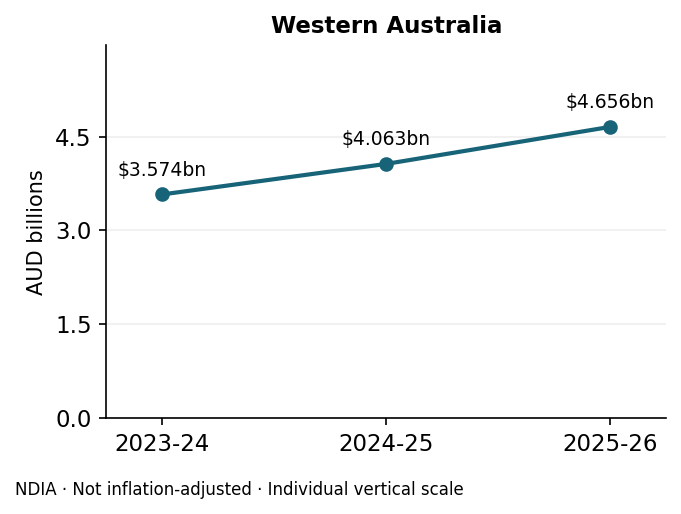
Payments by participant residence. Each chart has its own vertical scale, starting at zero. Compare the labelled amounts when comparing states; line steepness is not comparable across panels. Values are not adjusted for population or participant numbers.
View exact values: Australian Capital Territory payments
| Financial Year | State Code | State | Payments Aud |
|---|---|---|---|
| 2023-24 | ACT | Australian Capital Territory | $613,443,000 |
| 2024-25 | ACT | Australian Capital Territory | $669,270,000 |
| 2025-26 | ACT | Australian Capital Territory | $734,801,000 |
View exact values: New South Wales payments
| Financial Year | State Code | State | Payments Aud |
|---|---|---|---|
| 2023-24 | NSW | New South Wales | $12,803,070,000 |
| 2024-25 | NSW | New South Wales | $14,135,302,000 |
| 2025-26 | NSW | New South Wales | $15,858,637,000 |
View exact values: Northern Territory payments
| Financial Year | State Code | State | Payments Aud |
|---|---|---|---|
| 2023-24 | NT | Northern Territory | $620,150,000 |
| 2024-25 | NT | Northern Territory | $682,373,000 |
| 2025-26 | NT | Northern Territory | $749,958,000 |
View exact values: Queensland payments
| Financial Year | State Code | State | Payments Aud |
|---|---|---|---|
| 2023-24 | QLD | Queensland | $8,887,104,000 |
| 2024-25 | QLD | Queensland | $9,839,611,000 |
| 2025-26 | QLD | Queensland | $11,046,815,000 |
View exact values: South Australia payments
| Financial Year | State Code | State | Payments Aud |
|---|---|---|---|
| 2023-24 | SA | South Australia | $3,476,252,000 |
| 2024-25 | SA | South Australia | $3,875,560,000 |
| 2025-26 | SA | South Australia | $4,342,979,000 |
View exact values: Tasmania payments
| Financial Year | State Code | State | Payments Aud |
|---|---|---|---|
| 2023-24 | TAS | Tasmania | $988,769,000 |
| 2024-25 | TAS | Tasmania | $1,102,578,000 |
| 2025-26 | TAS | Tasmania | $1,213,607,000 |
View exact values: Victoria payments
| Financial Year | State Code | State | Payments Aud |
|---|---|---|---|
| 2023-24 | VIC | Victoria | $10,268,475,000 |
| 2024-25 | VIC | Victoria | $11,447,351,000 |
| 2025-26 | VIC | Victoria | $12,832,024,000 |
View exact values: Western Australia payments
| Financial Year | State Code | State | Payments Aud |
|---|---|---|---|
| 2023-24 | WA | Western Australia | $3,574,445,000 |
| 2024-25 | WA | Western Australia | $4,063,030,000 |
| 2025-26 | WA | Western Australia | $4,655,756,000 |
Other territories and Missing location are excluded from these charts because their totals are unavailable. They remain represented in the national aggregate. No suppressed values have been estimated.
Sources and interpretation
Source: NDIA payments datasets, June 2024, June 2025 and June 2026 snapshots, retrieved 16 October 2026. These are payments for the preceding 12 months, not quarterly payments, plan budgets or measures of service quality.
Historical values use their original snapshots. Differences in reporting, revisions and classification may affect comparisons. The payments dataset differs slightly from matching quarterly-report totals; the reason has not been established. See each annual page for the exact comparison and source qualifications:
Download images and data beside each chart. Please retain the financial year, units and source attribution when sharing.