July 2018 to June 2019
| State Territory | Payment Dollars | Share Percent |
|---|---|---|
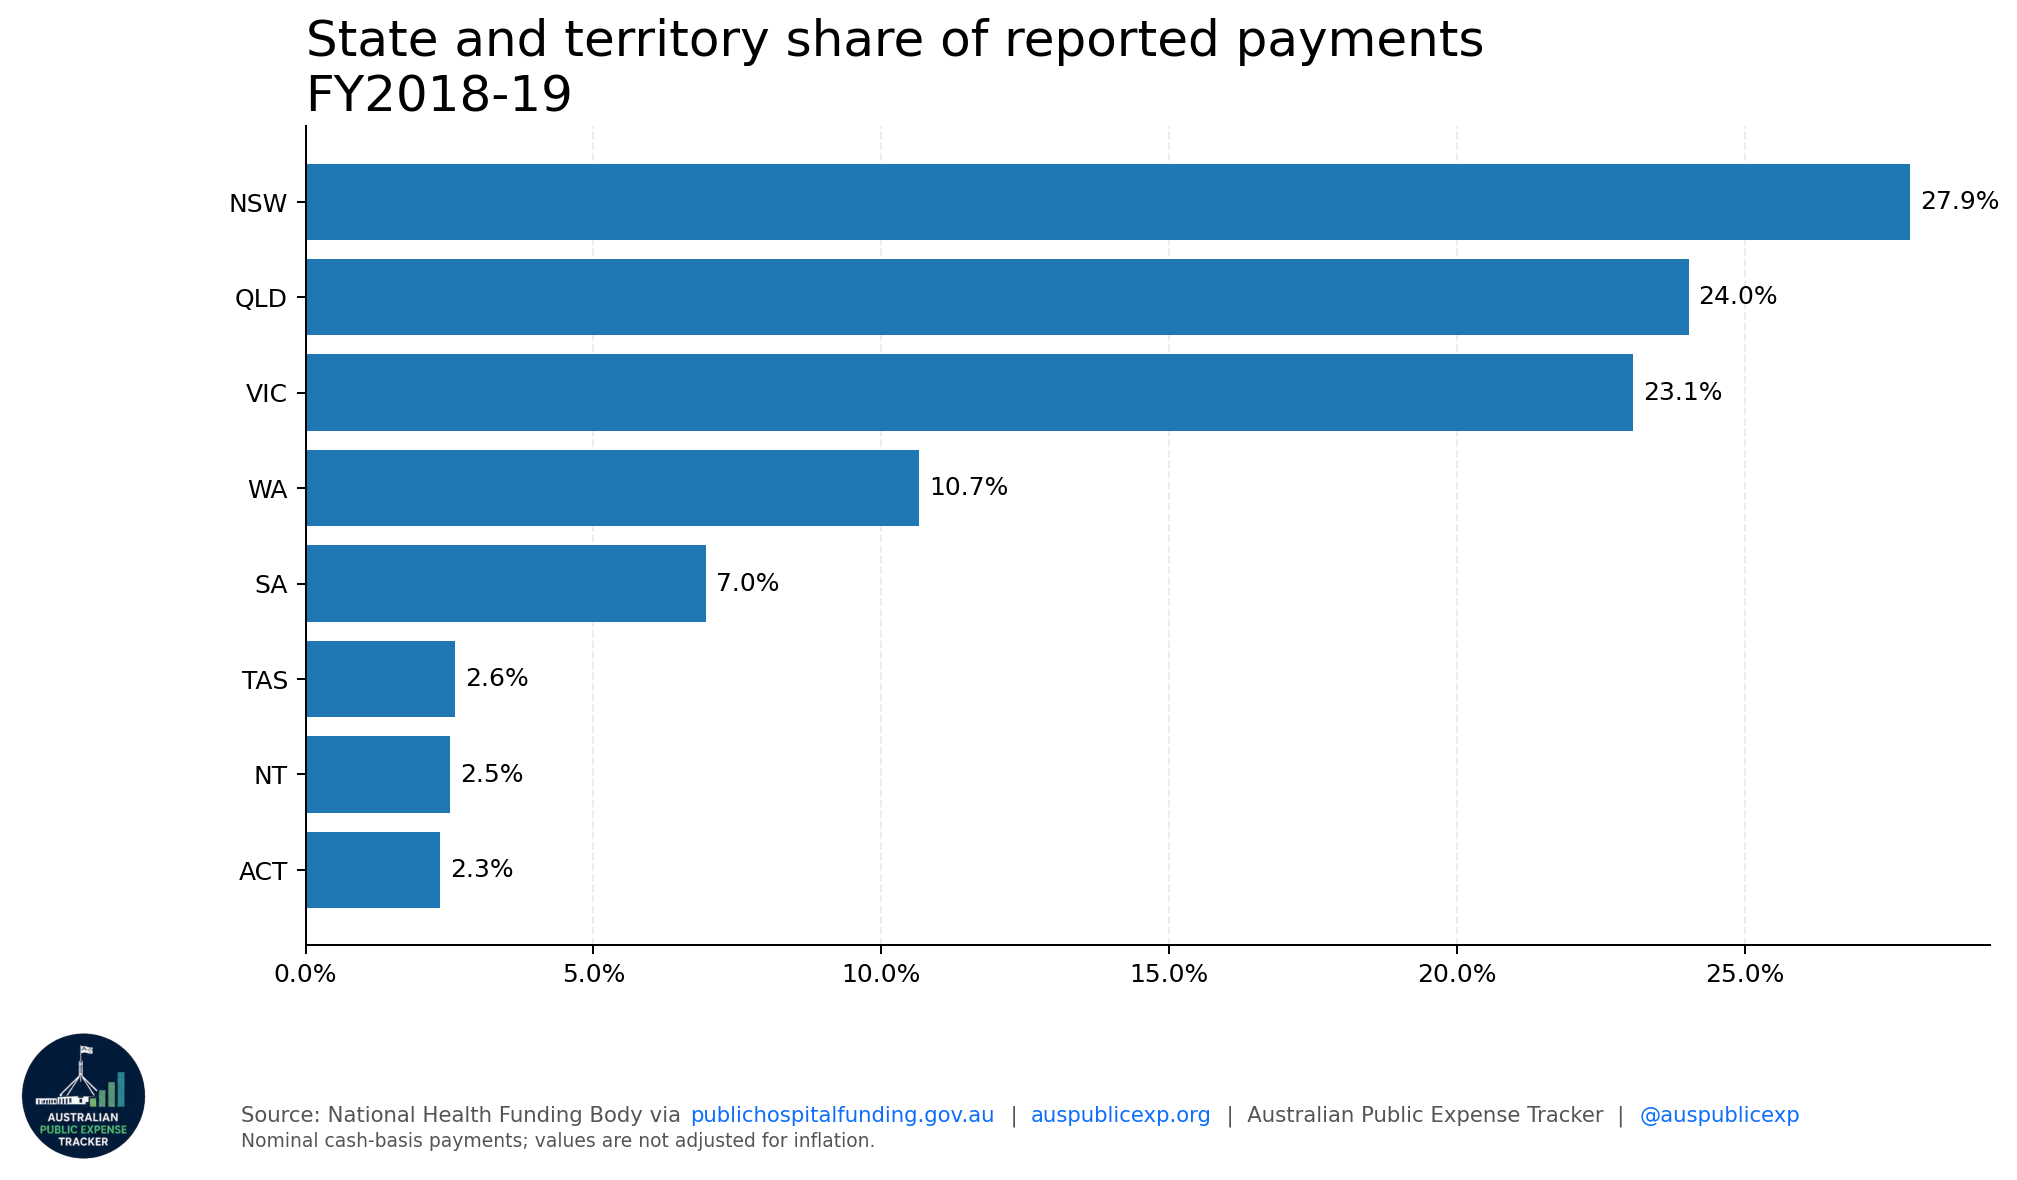
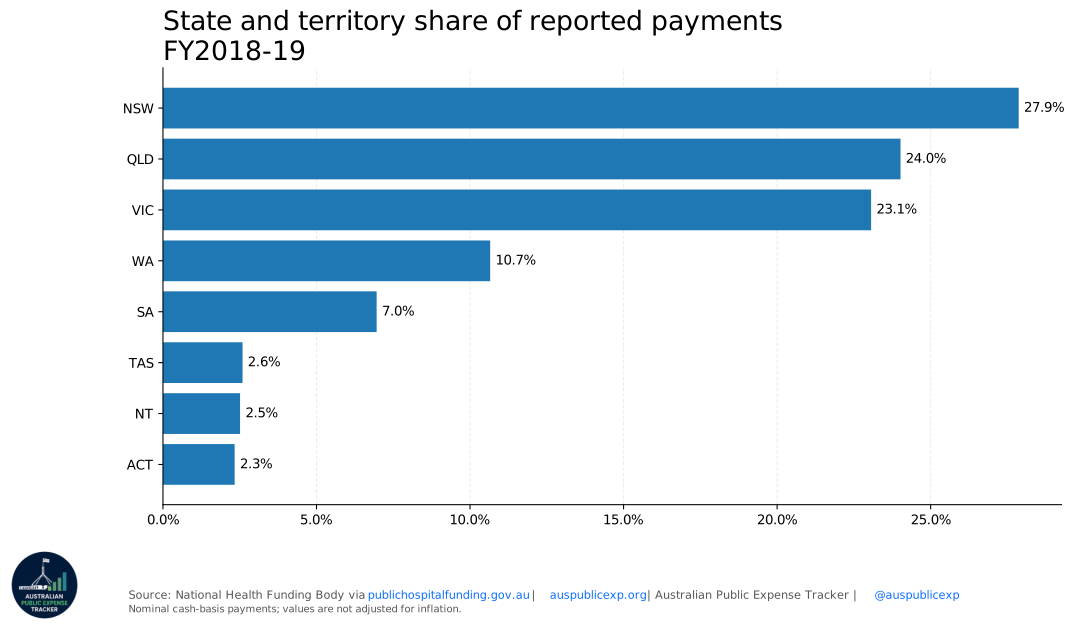
| NSW | $13,933,797,747 | 28 |
| QLD | $12,009,427,854 | 24 |
| VIC | $11,530,371,278 | 23 |
| WA | $5,328,253,093 | 11 |
| SA | $3,479,285,995 | 7 |
| TAS | $1,295,822,921 | 3 |
| NT | $1,255,545,674 | 3 |
| ACT | $1,167,145,400 | 2 |
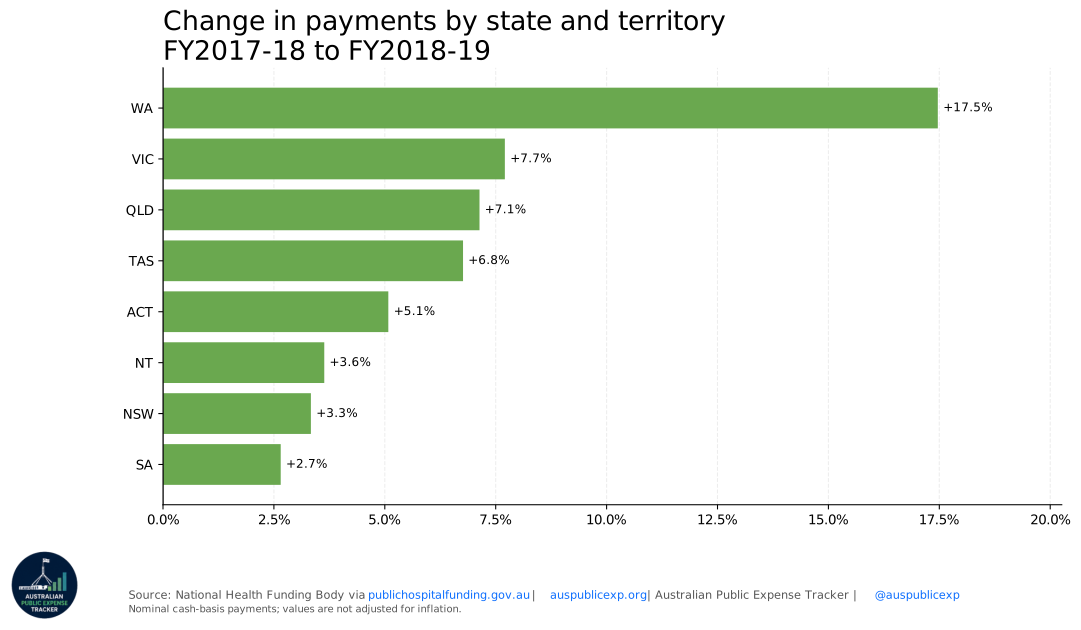
| State Territory | Current Payment Dollars | Share Percent | Previous Payment Dollars | Change Dollars | Change Percent |
|---|---|---|---|---|---|
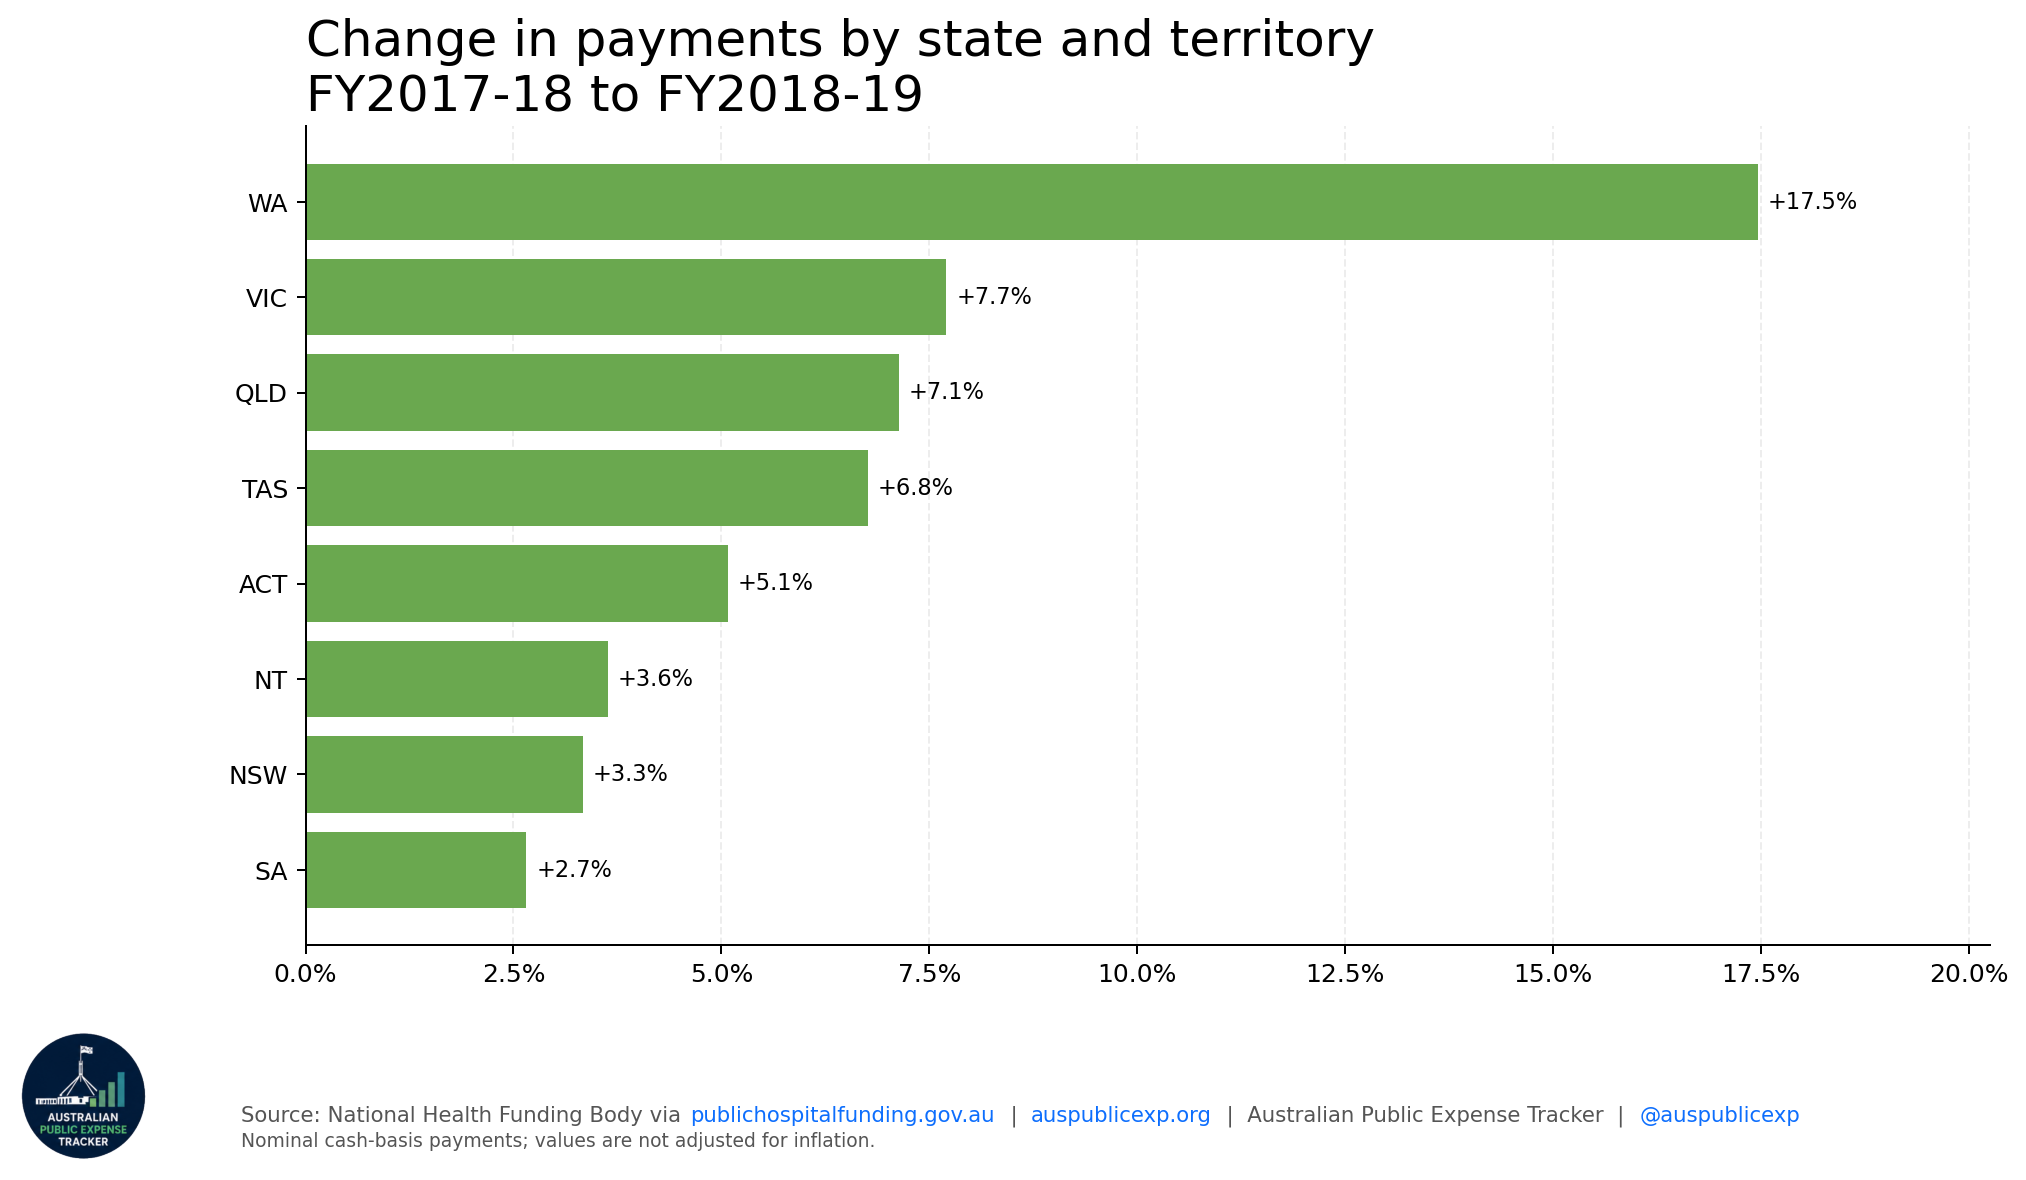
| WA | $5,328,253,093 | 11 | $4,535,993,659 | $792,259,434 | 17 |
| VIC | $11,530,371,278 | 23 | $10,705,380,847 | $824,990,431 | 8 |
| QLD | $12,009,427,854 | 24 | $11,209,641,267 | $799,786,587 | 7 |
| TAS | $1,295,822,921 | 3 | $1,213,732,351 | $82,090,570 | 7 |
| ACT | $1,167,145,400 | 2 | $1,110,727,722 | $56,417,678 | 5 |
| NT | $1,255,545,674 | 3 | $1,211,502,470 | $44,043,204 | 4 |
| NSW | $13,933,797,747 | 28 | $13,484,254,357 | $449,543,390 | 3 |
| SA | $3,479,285,995 | 7 | $3,389,353,057 | $89,932,938 | 3 |

| Service Category | Current Payment Dollars | Previous Payment Dollars | Change Dollars |
|---|---|---|---|
| Acute admitted | $26,489,795,209 | $18,394,642,538 | $8,095,152,671 |
| Non-admitted | $6,124,476,971 | $4,629,646,866 | $1,494,830,105 |
| Emergency department | $4,604,449,658 | $3,619,658,437 | $984,791,221 |
| Sub-acute | $2,432,059,619 | $1,622,138,494 | $809,921,125 |
| Admitted mental health | $2,093,341,136 | $1,723,908,020 | $369,433,116 |
| Block (no service category specified) | $1,601,933,642 | $1,312,824,469 | $289,109,173 |
| Small rural hospitals | $2,230,014,892 | $2,056,600,582 | $173,414,310 |
| Other non-admitted services | $1,062,458,421 | $931,506,927 | $130,951,494 |
| Teaching, training and research | $1,086,648,301 | $1,179,770,998 | $-93,122,697 |
| ABF (no service category specified) | $0 | $9,177,213,872 | $-9,177,213,872 |