Australian Public Expense Tracker Banner
Next year →

Public Hospital Funding FY2015-16 Annual Summary

July 2015 to June 2016
These are nominal cash-basis payments through the National Health Funding Pool and State Managed Funds—not the complete cost of operating every public hospital. Values are not adjusted for inflation, and service-category charts do not cover every payment type.
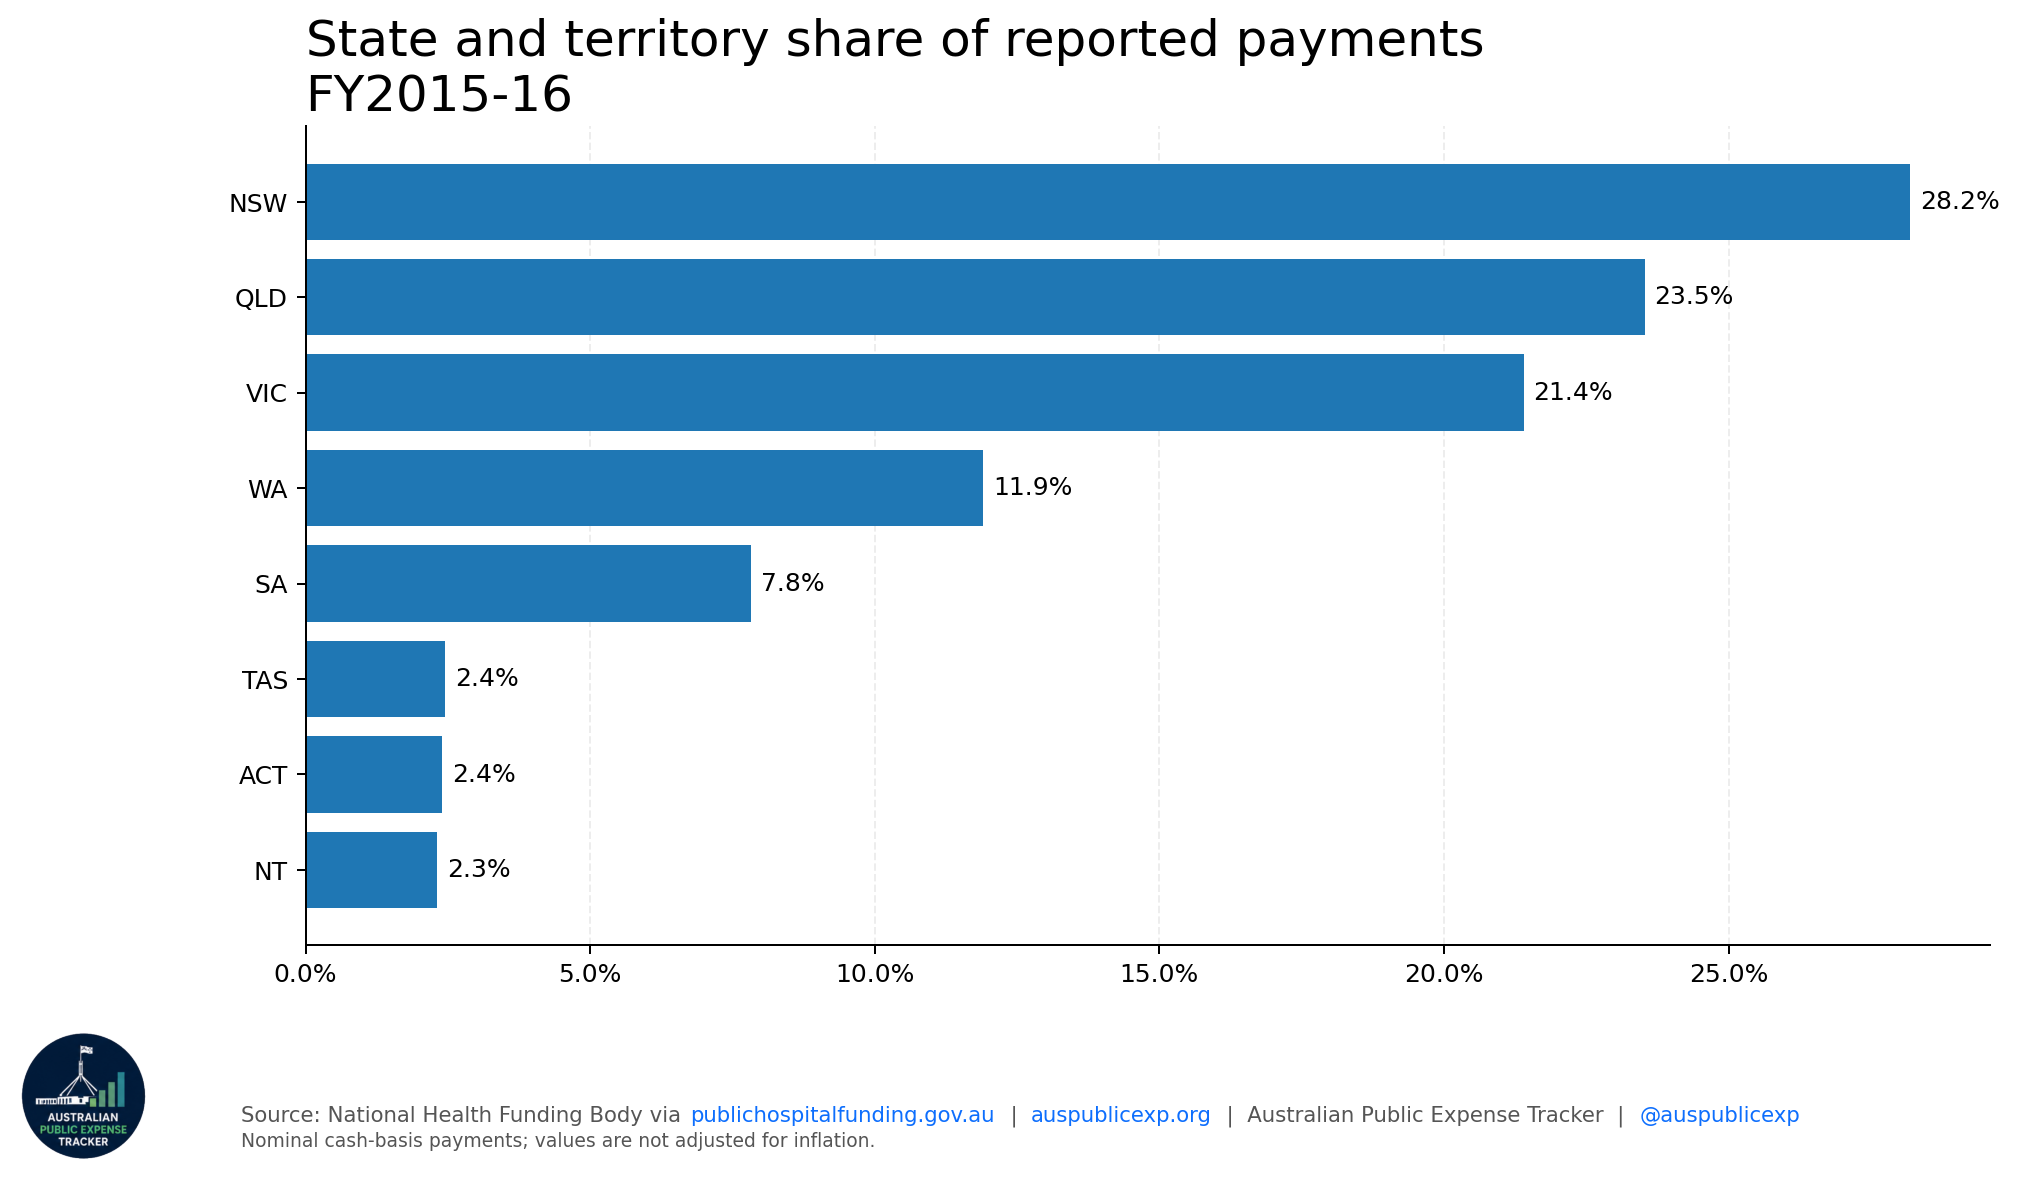
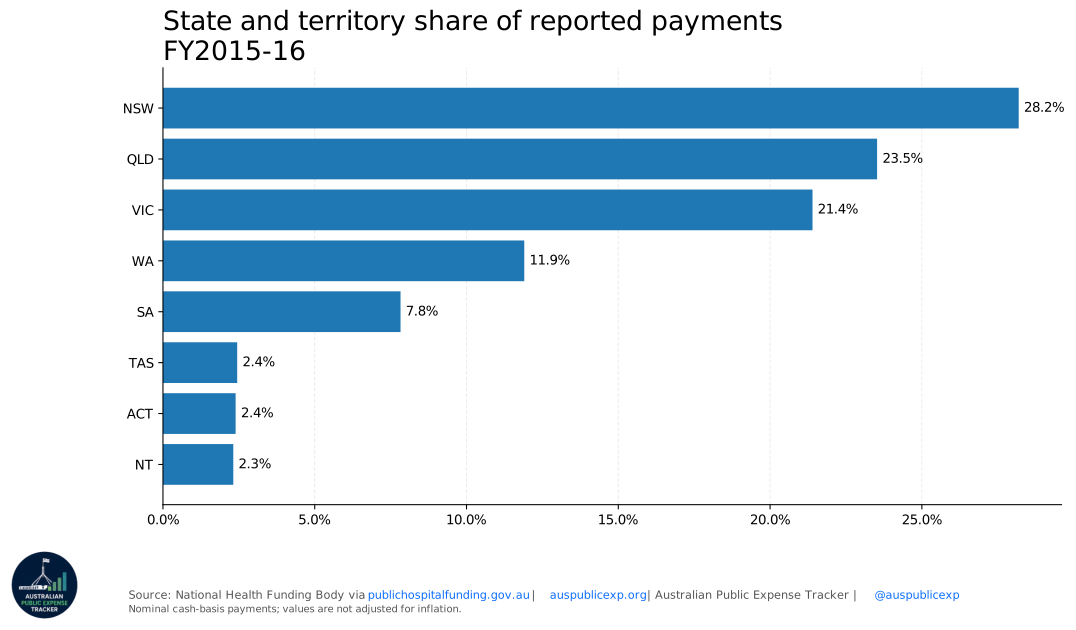
State Share
View underlying data
State Share — underlying chart data
State TerritoryPayment DollarsShare Percent
NSW$11,900,936,35328
QLD$9,931,395,45024
VIC$9,033,411,30721
WA$5,024,889,26412
SA$3,304,026,4398
TAS$1,032,442,0802
ACT$1,010,494,2072
NT$978,125,2062
Download CSV
Hospital funding overview Next year →