July 2021 to June 2022
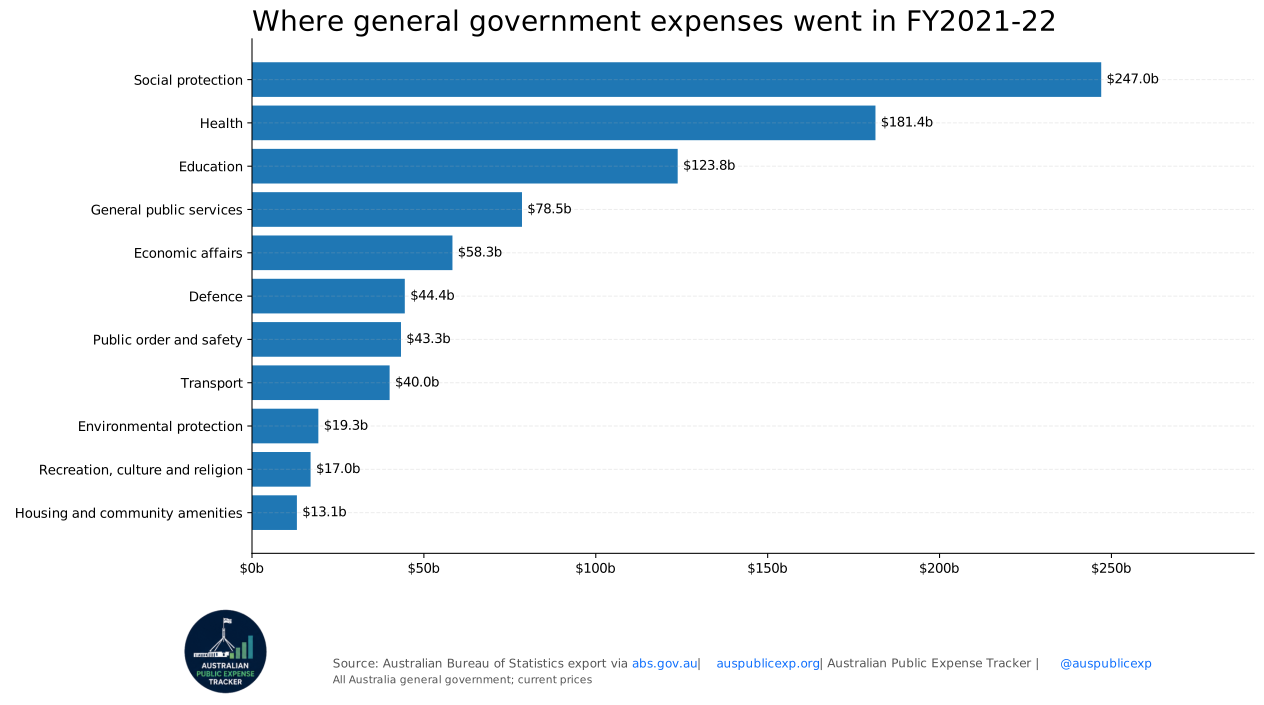
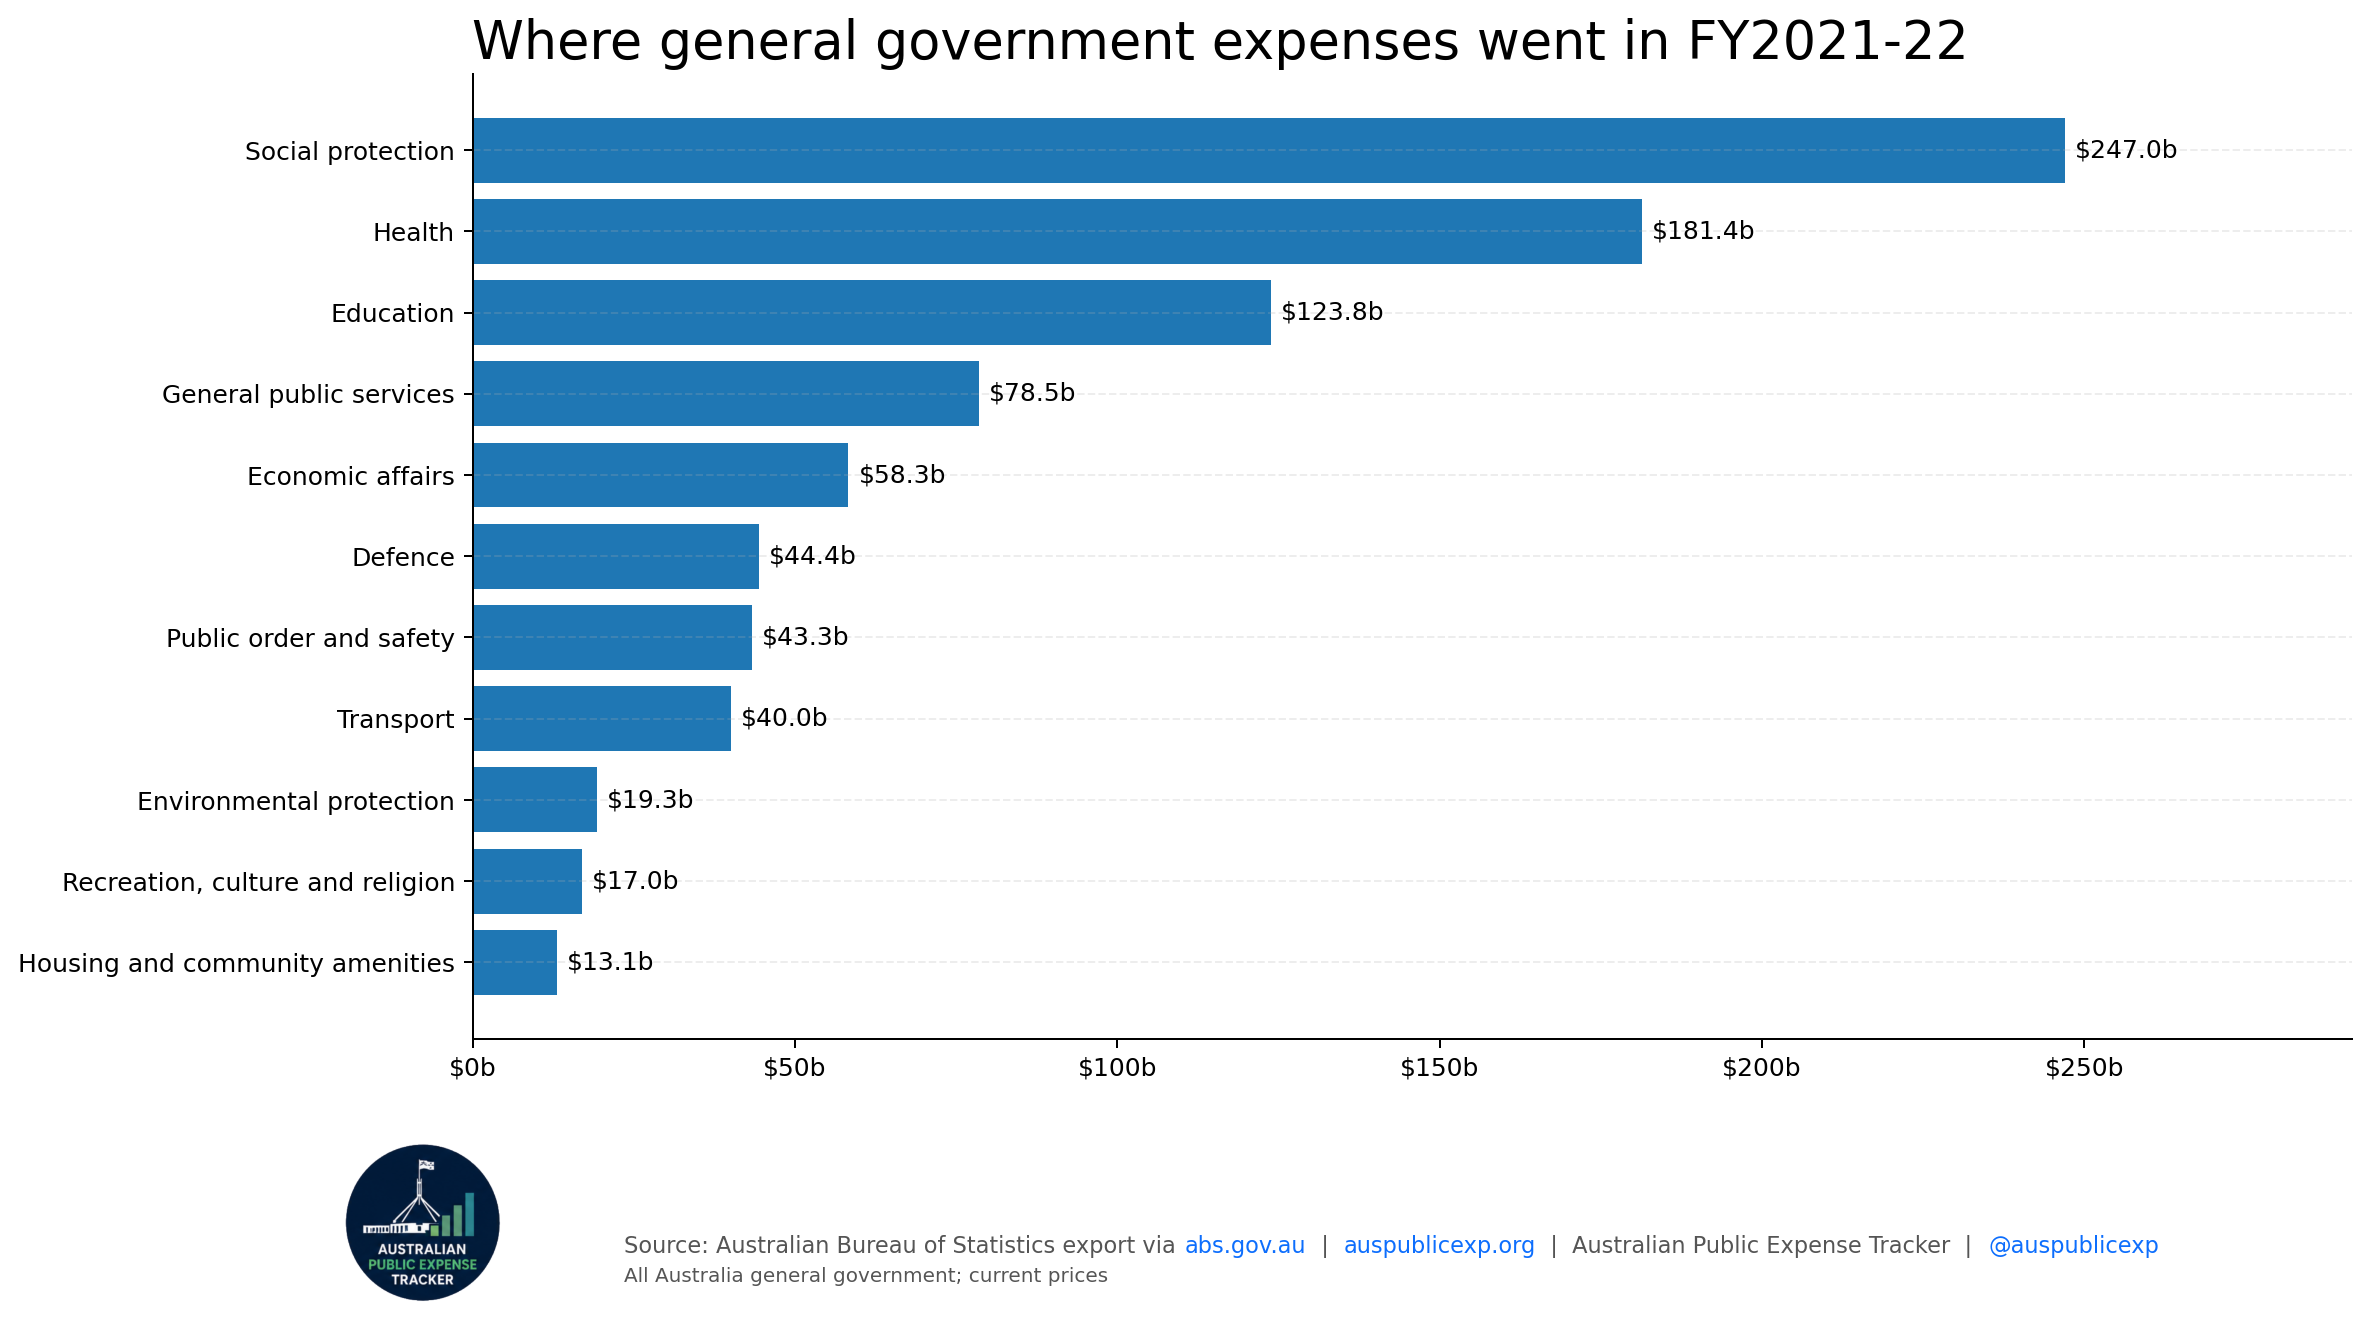
| purpose | value millions |
|---|---|
| Social protection | $247,028m |
| Health | $181,358m |
| Education | $123,827m |
| General public services | $78,537m |
| Economic affairs | $58,310m |
| Defence | $44,447m |
| Public order and safety | $43,339m |
| Transport | $40,030m |
| Environmental protection | $19,300m |
| Recreation, culture and religion | $17,038m |
| Housing and community amenities | $13,060m |
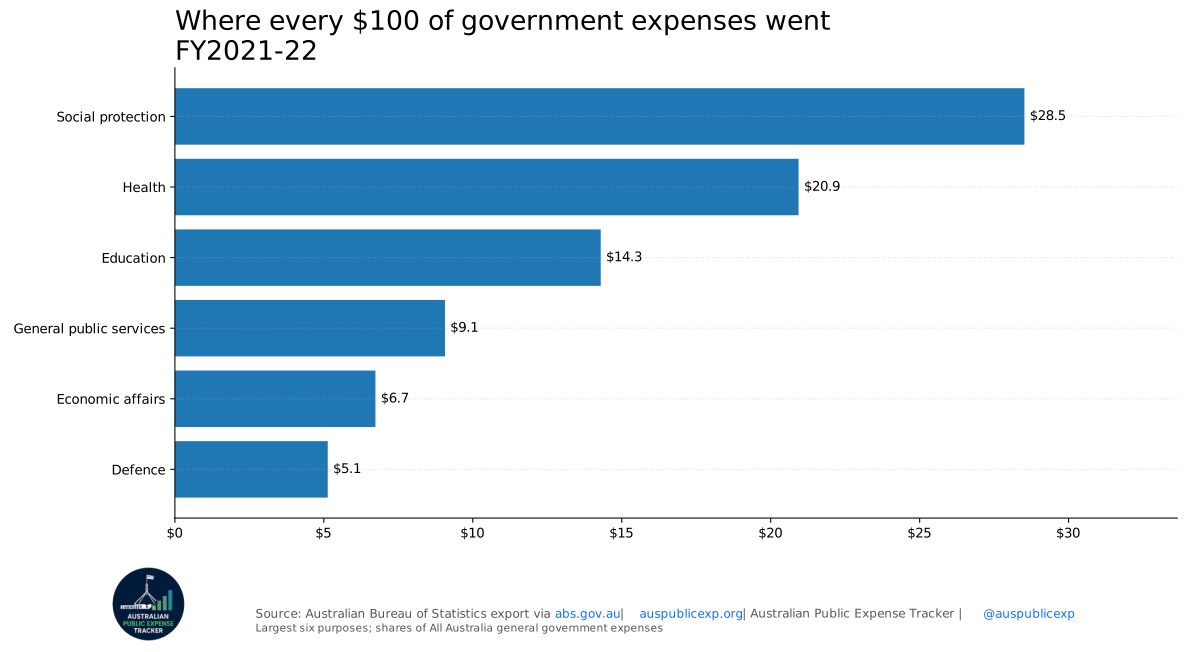
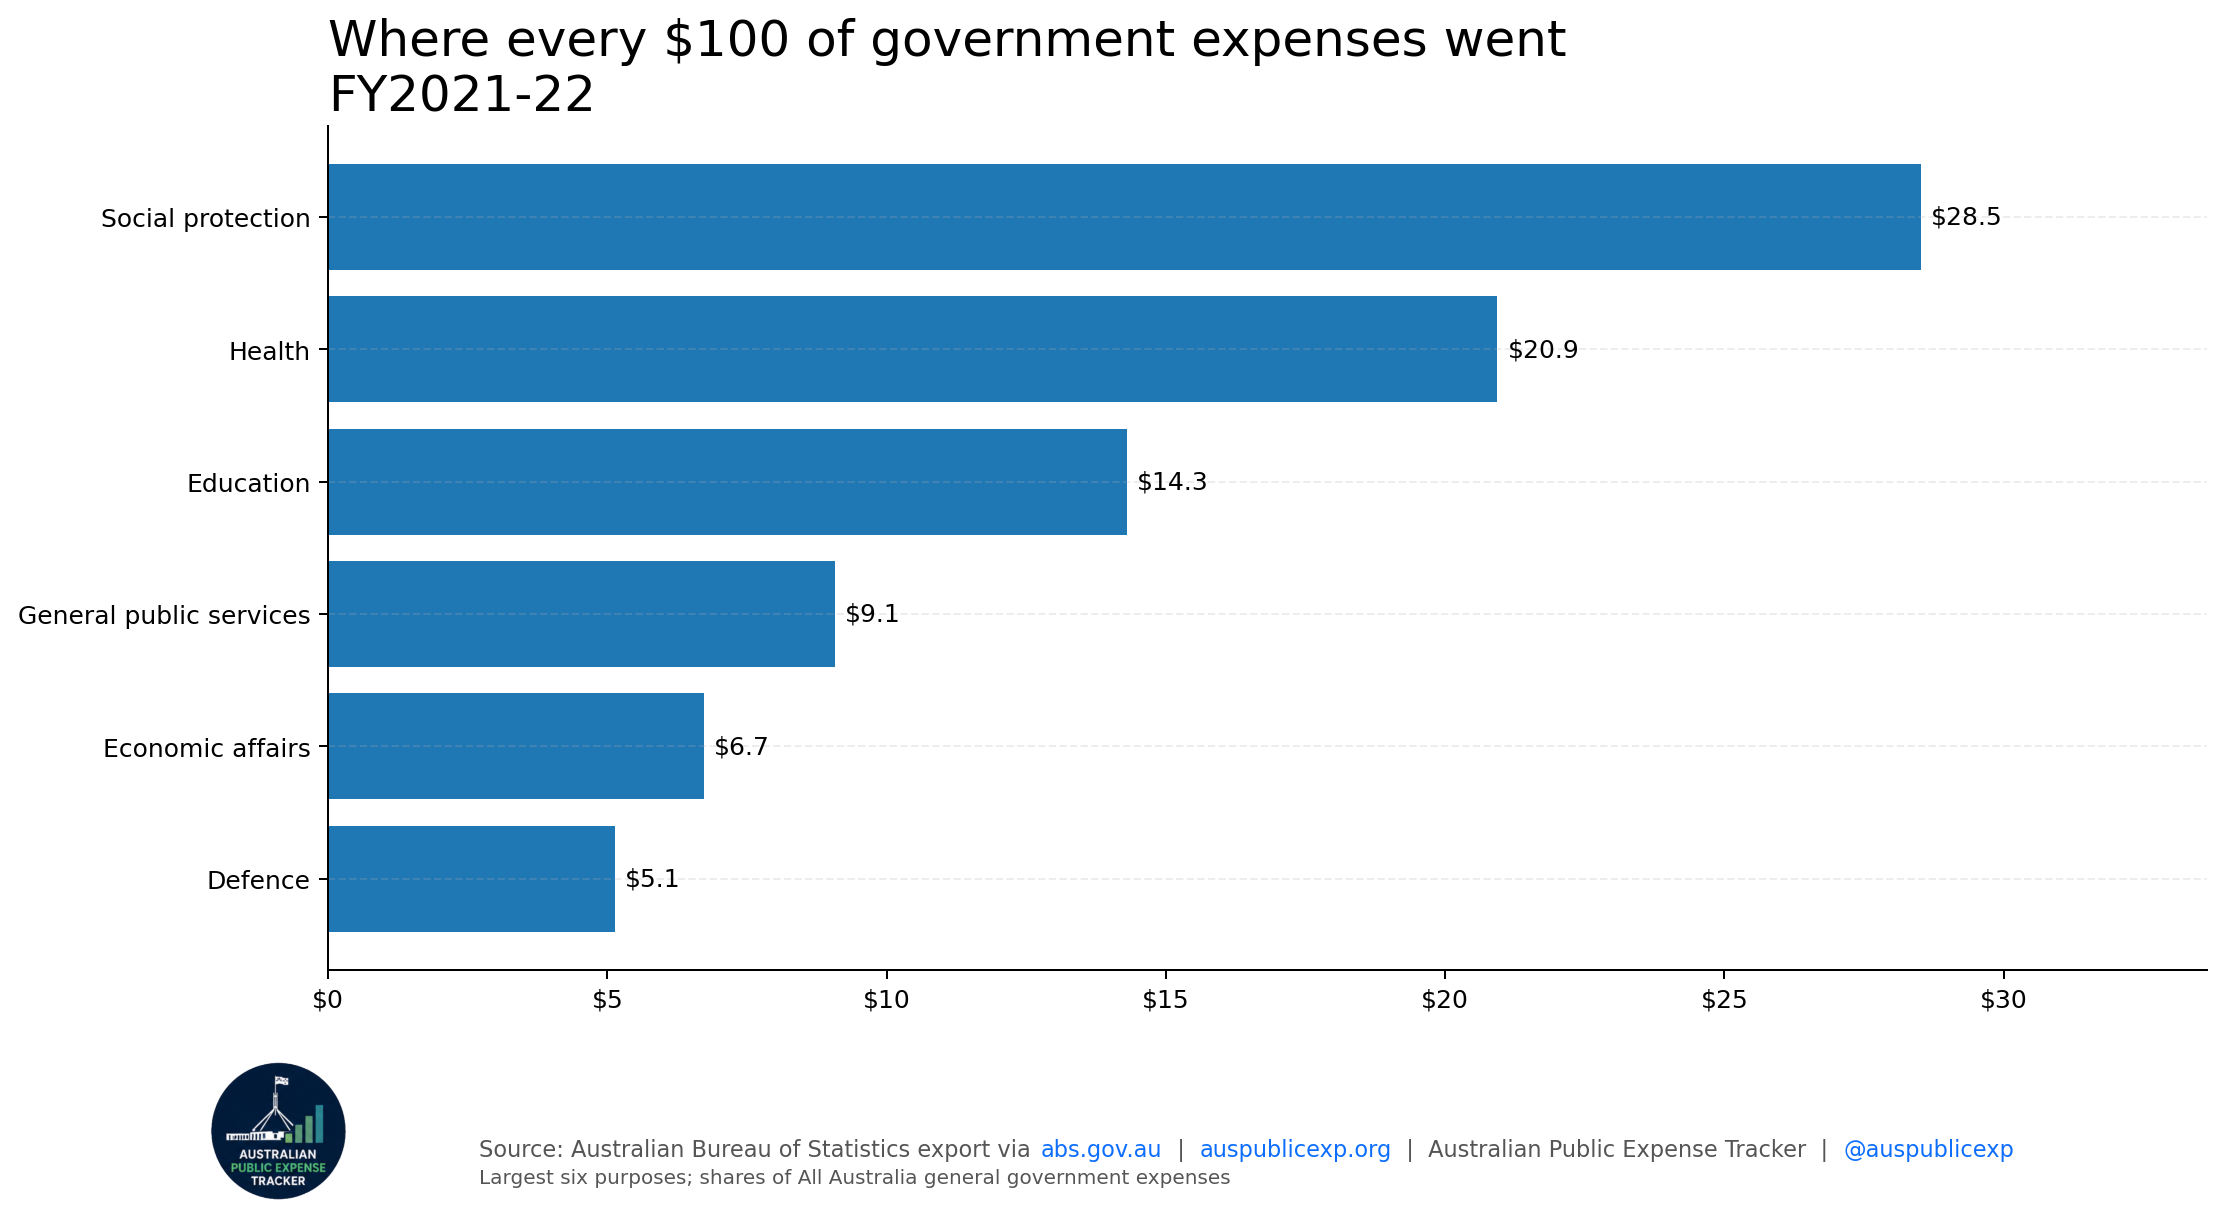
| purpose | dollars per 100 |
|---|---|
| Social protection | $28.5 |
| Health | $20.9 |
| Education | $14.3 |
| General public services | $9.1 |
| Economic affairs | $6.7 |
| Defence | $5.1 |
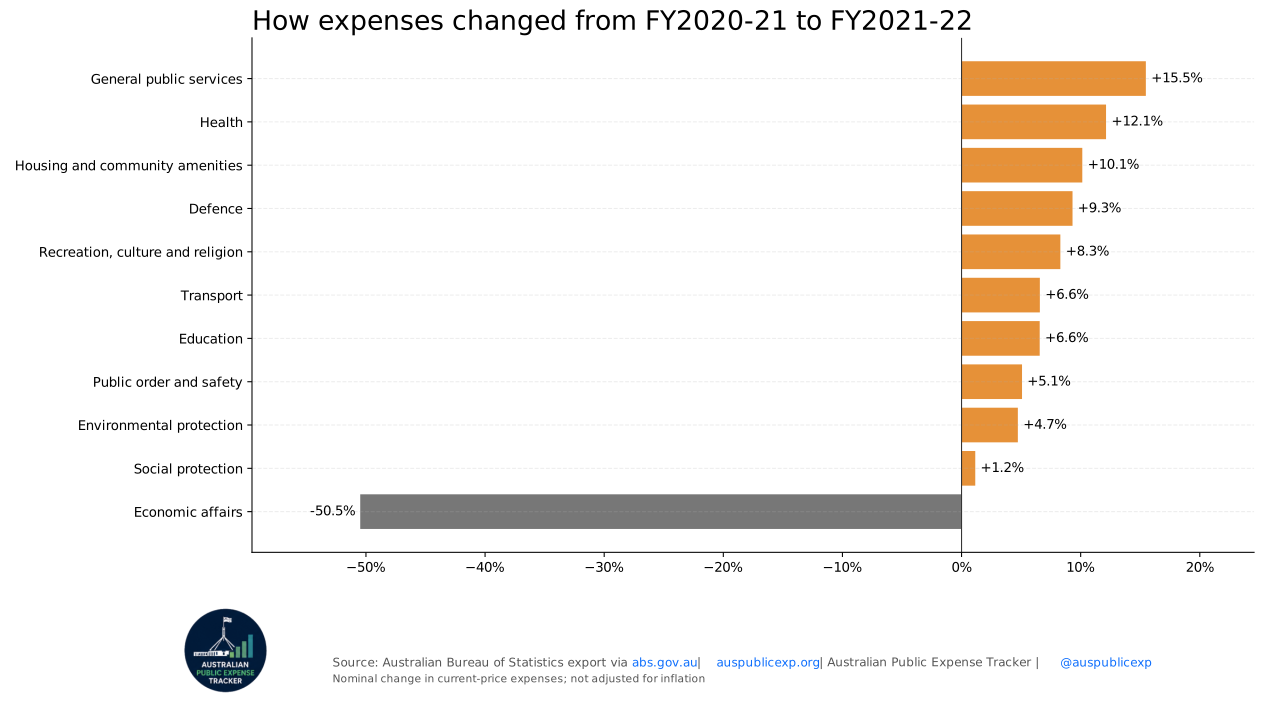
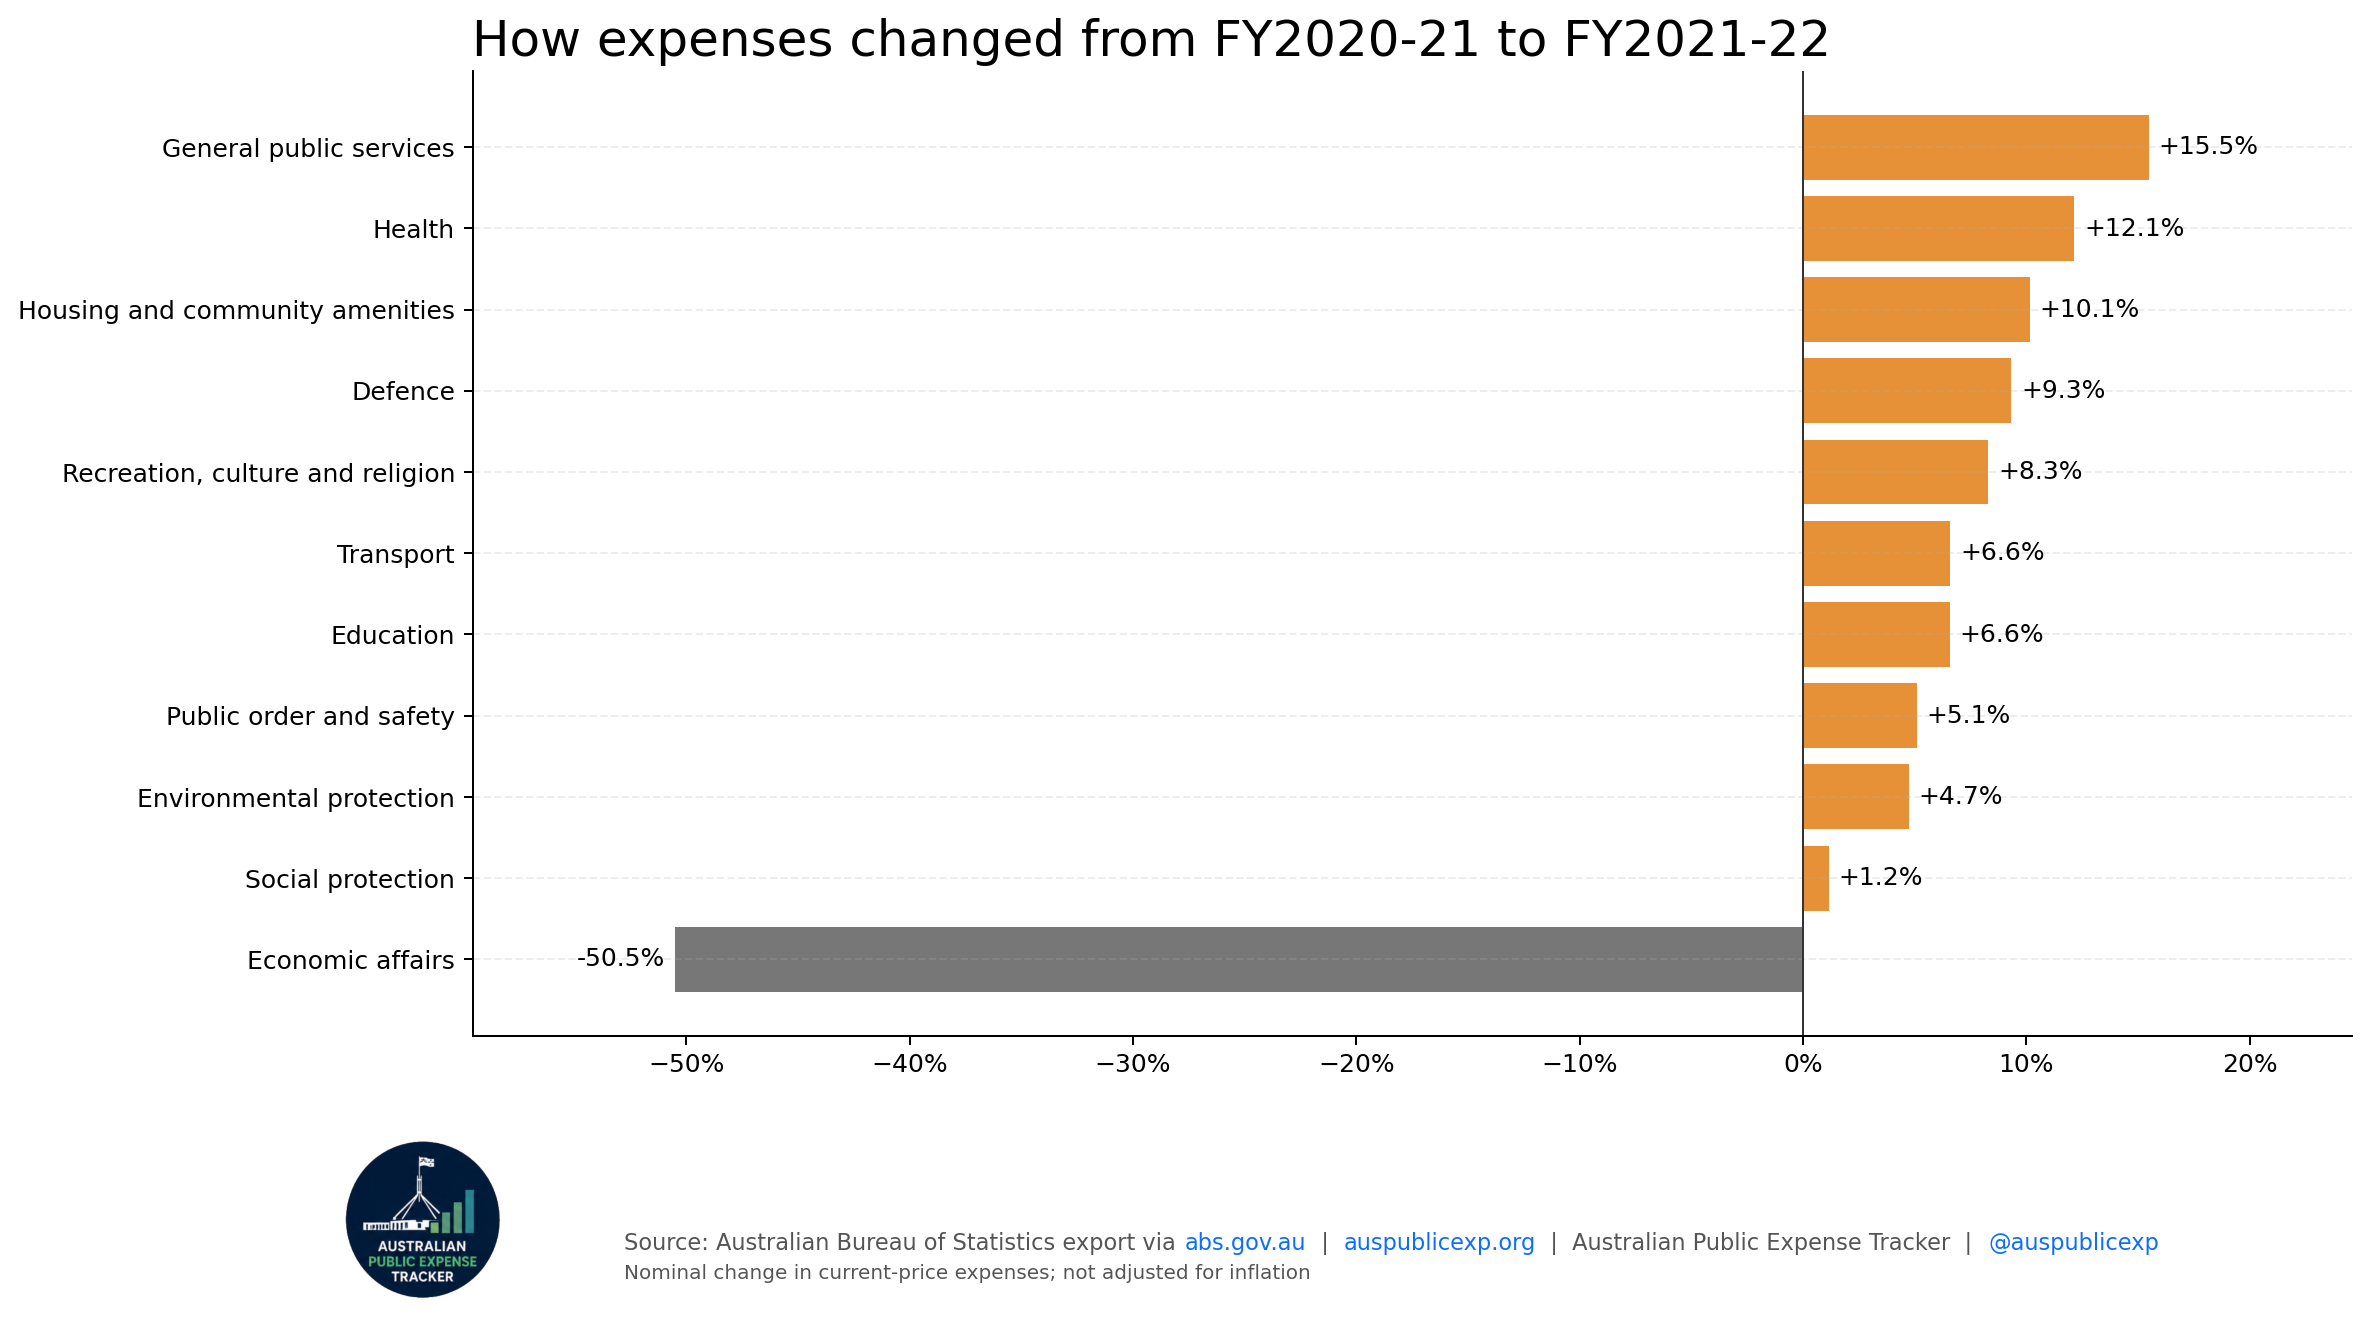
| purpose | nominal change fraction |
|---|---|
| Economic affairs | -50.5% |
| Social protection | 1.2% |
| Environmental protection | 4.7% |
| Public order and safety | 5.1% |
| Education | 6.6% |
| Transport | 6.6% |
| Recreation, culture and religion | 8.3% |
| Defence | 9.3% |
| Housing and community amenities | 10.1% |
| Health | 12.1% |
| General public services | 15.5% |
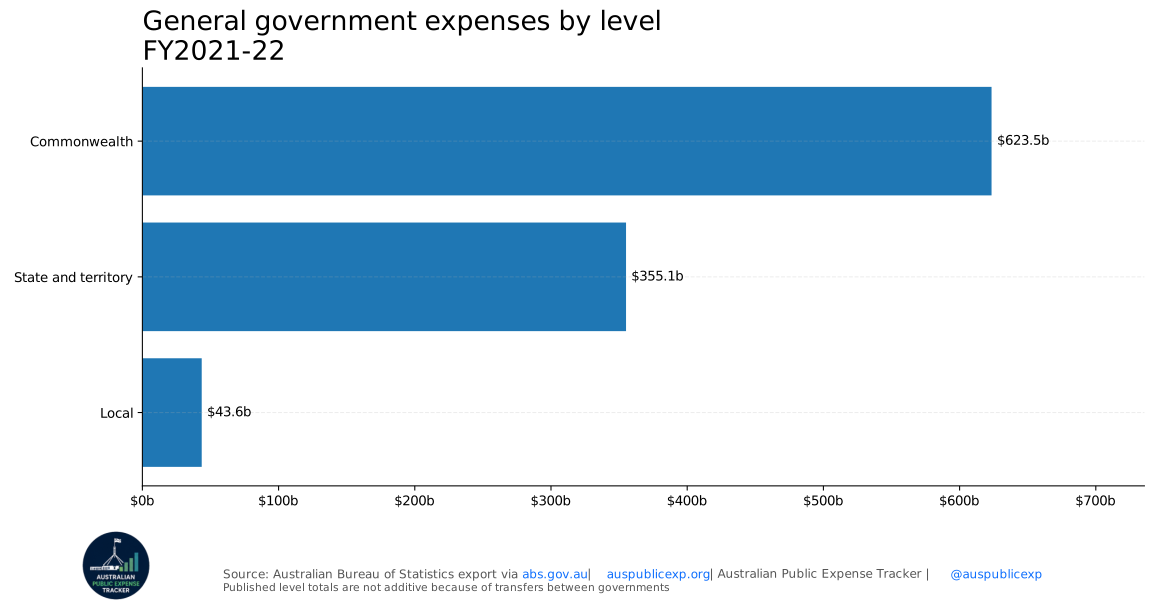
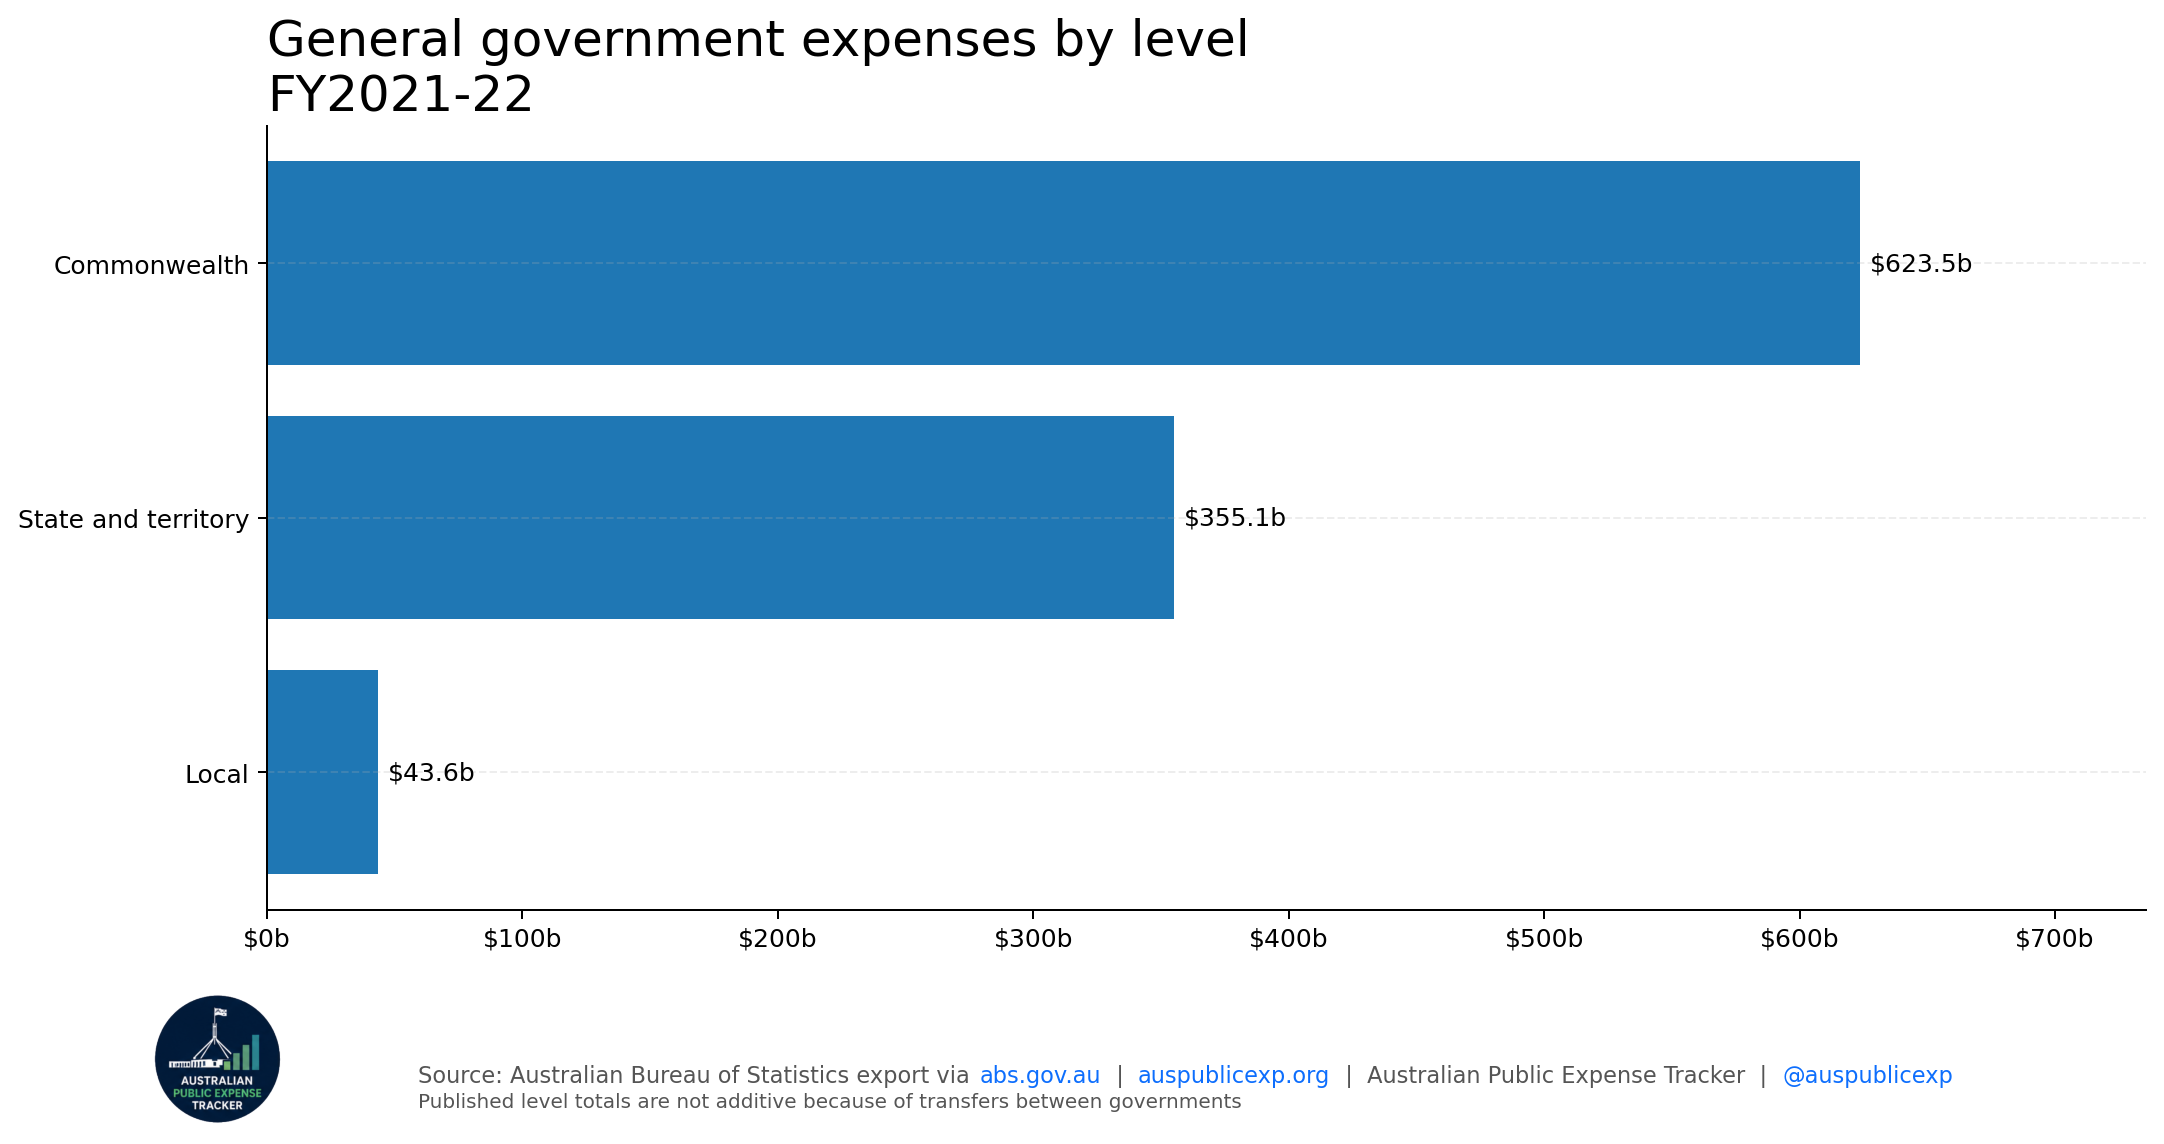
| government level | value millions |
|---|---|
| Commonwealth | $623,457m |
| State and territory | $355,100m |
| Local | $43,565m |