July 2017 to June 2018
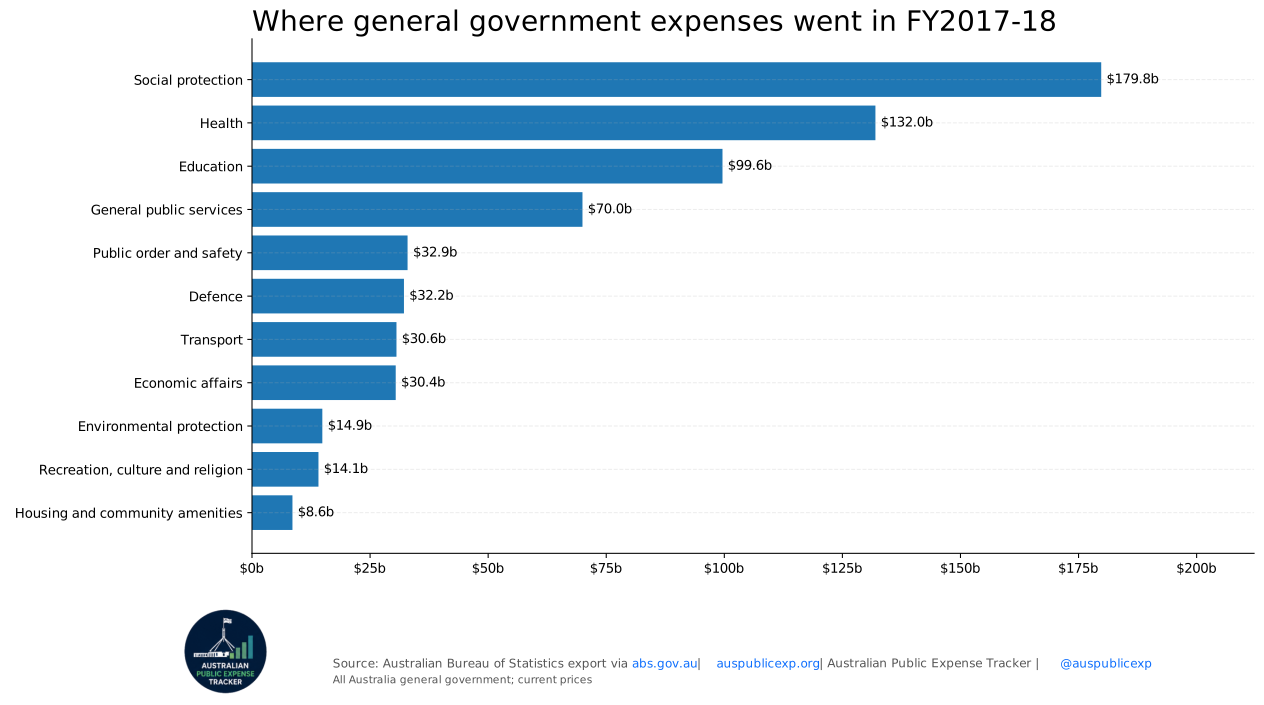
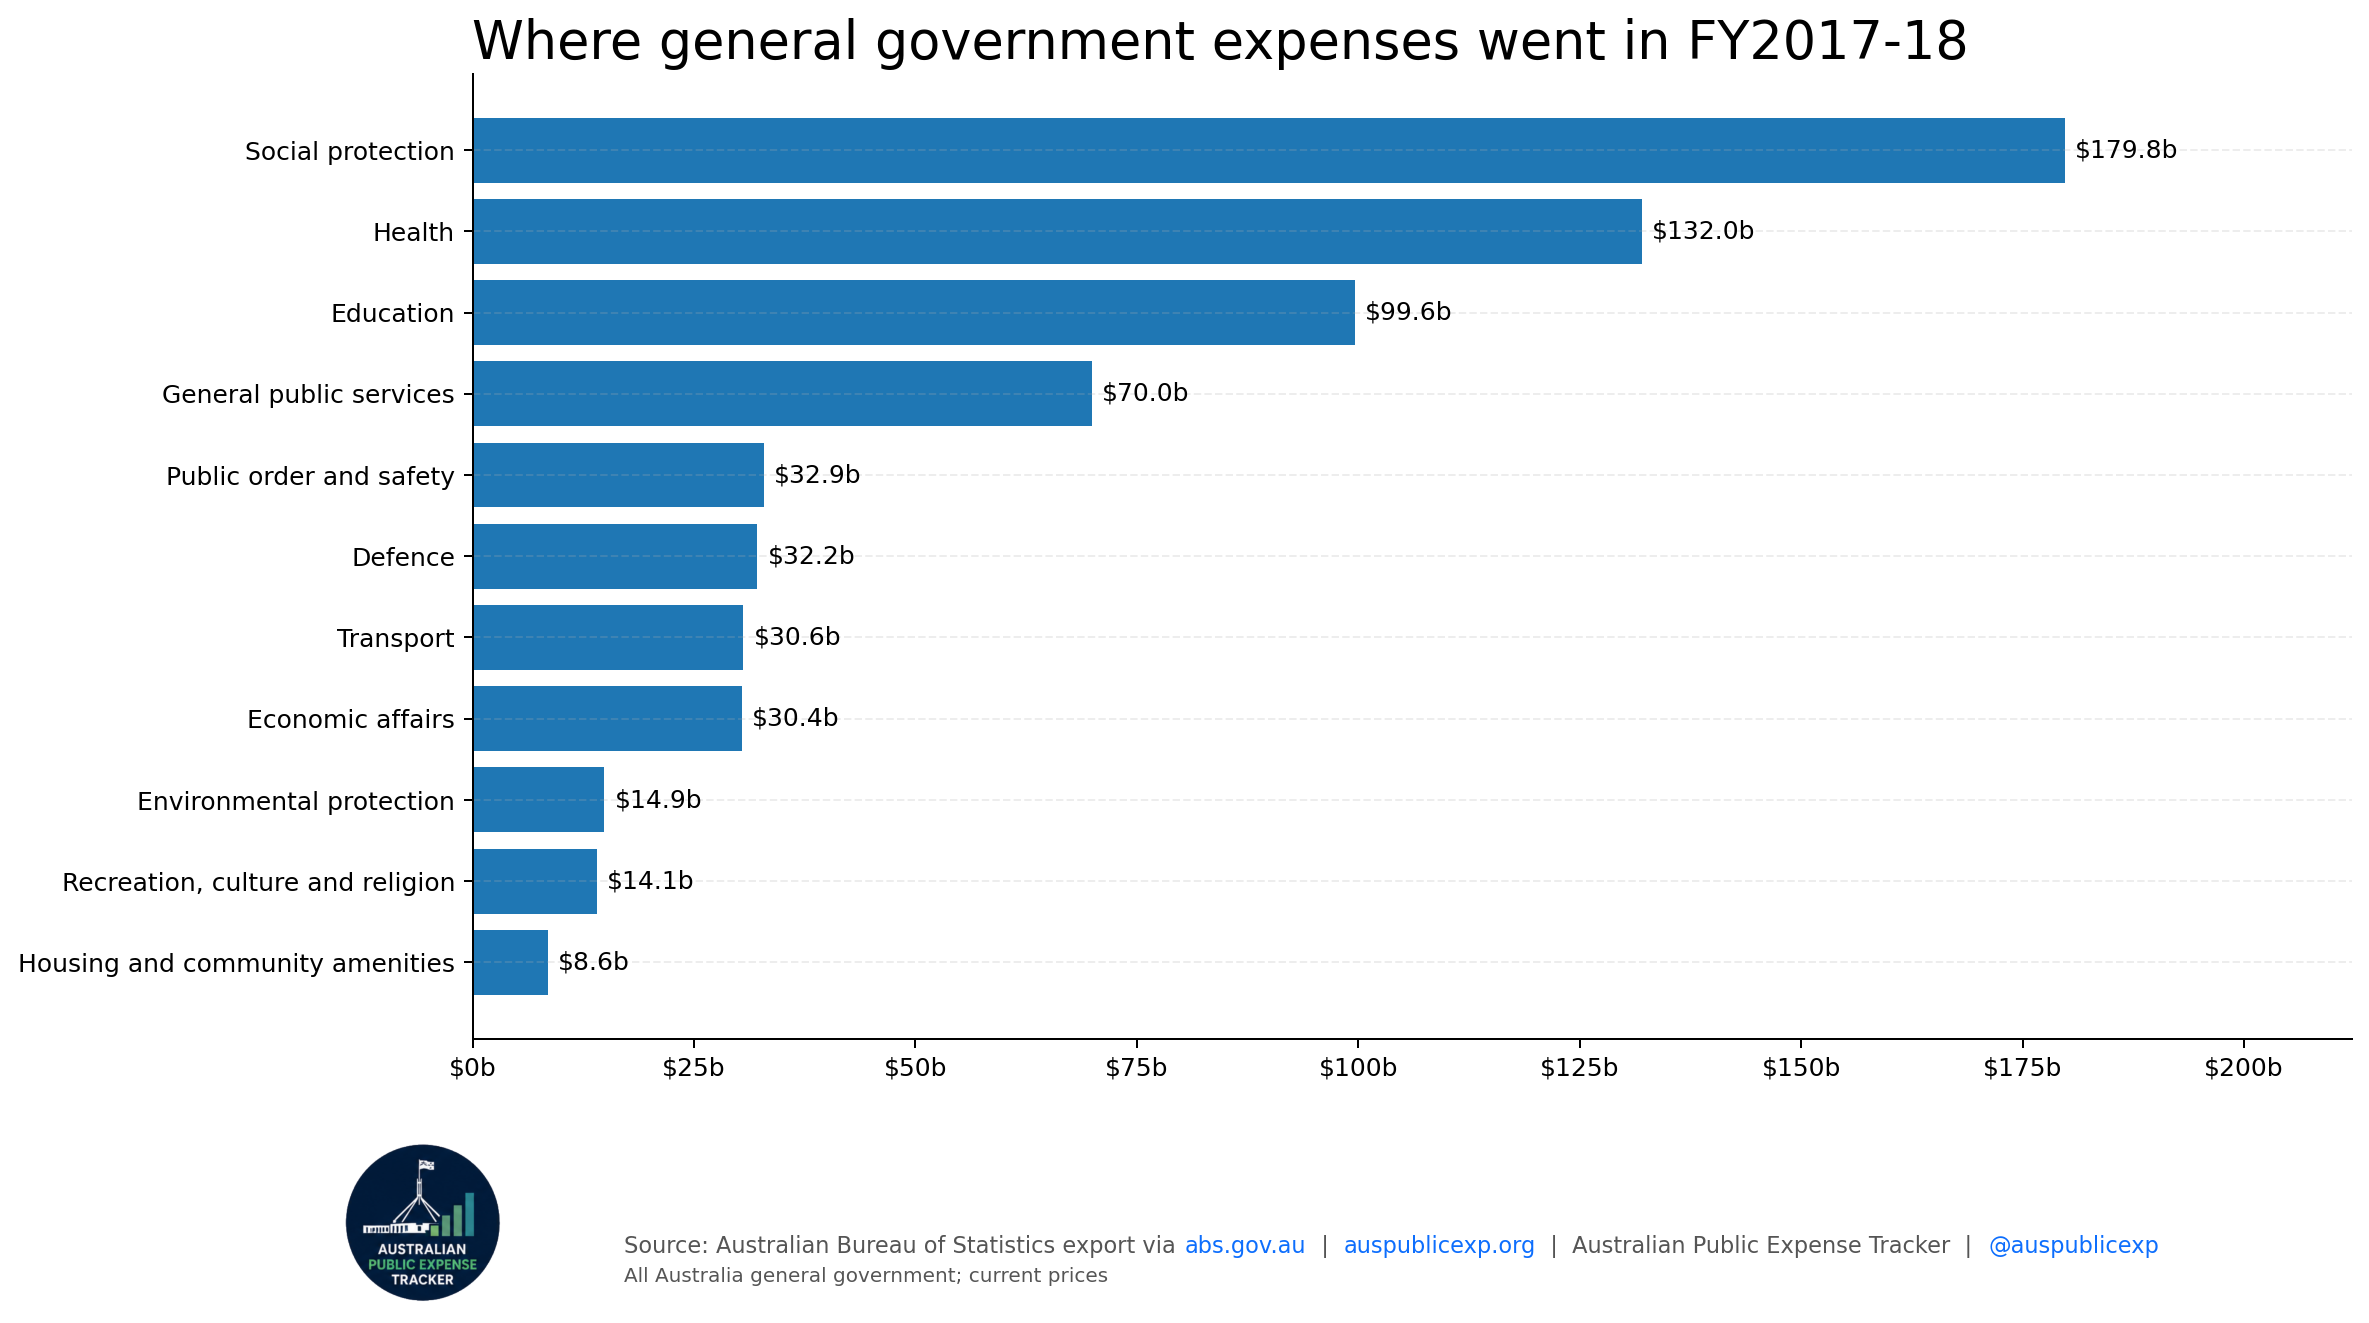
| purpose | value millions |
|---|---|
| Social protection | $179,799m |
| Health | $131,993m |
| Education | $99,613m |
| General public services | $69,969m |
| Public order and safety | $32,937m |
| Defence | $32,172m |
| Transport | $30,588m |
| Economic affairs | $30,428m |
| Environmental protection | $14,890m |
| Recreation, culture and religion | $14,071m |
| Housing and community amenities | $8,565m |
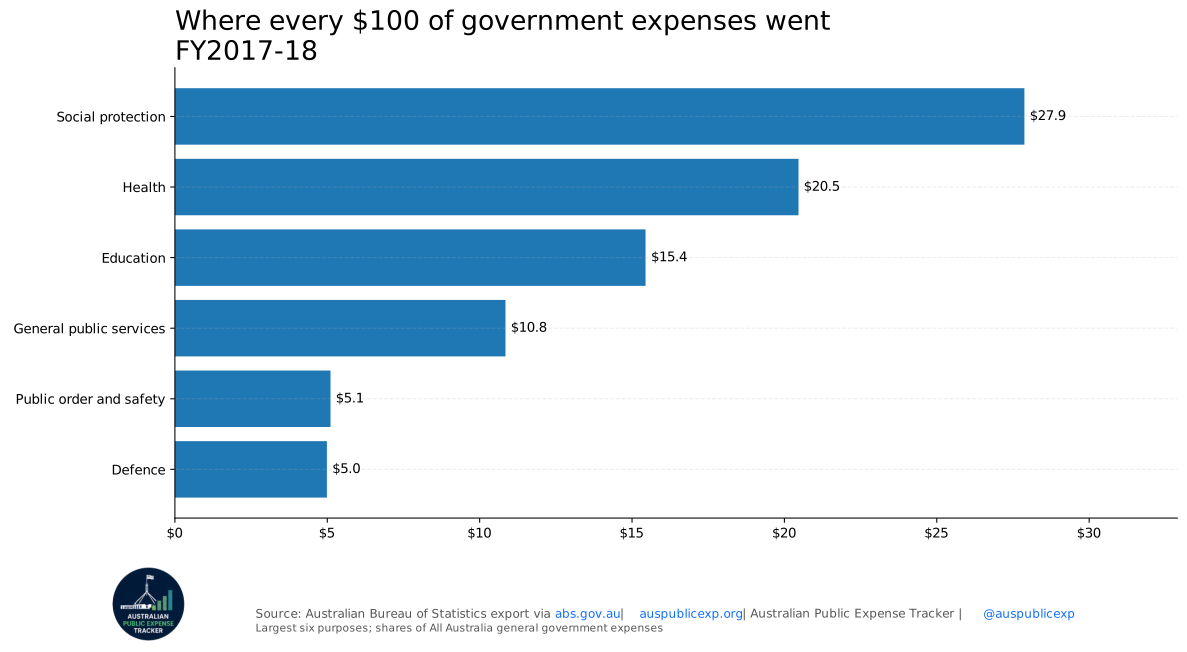
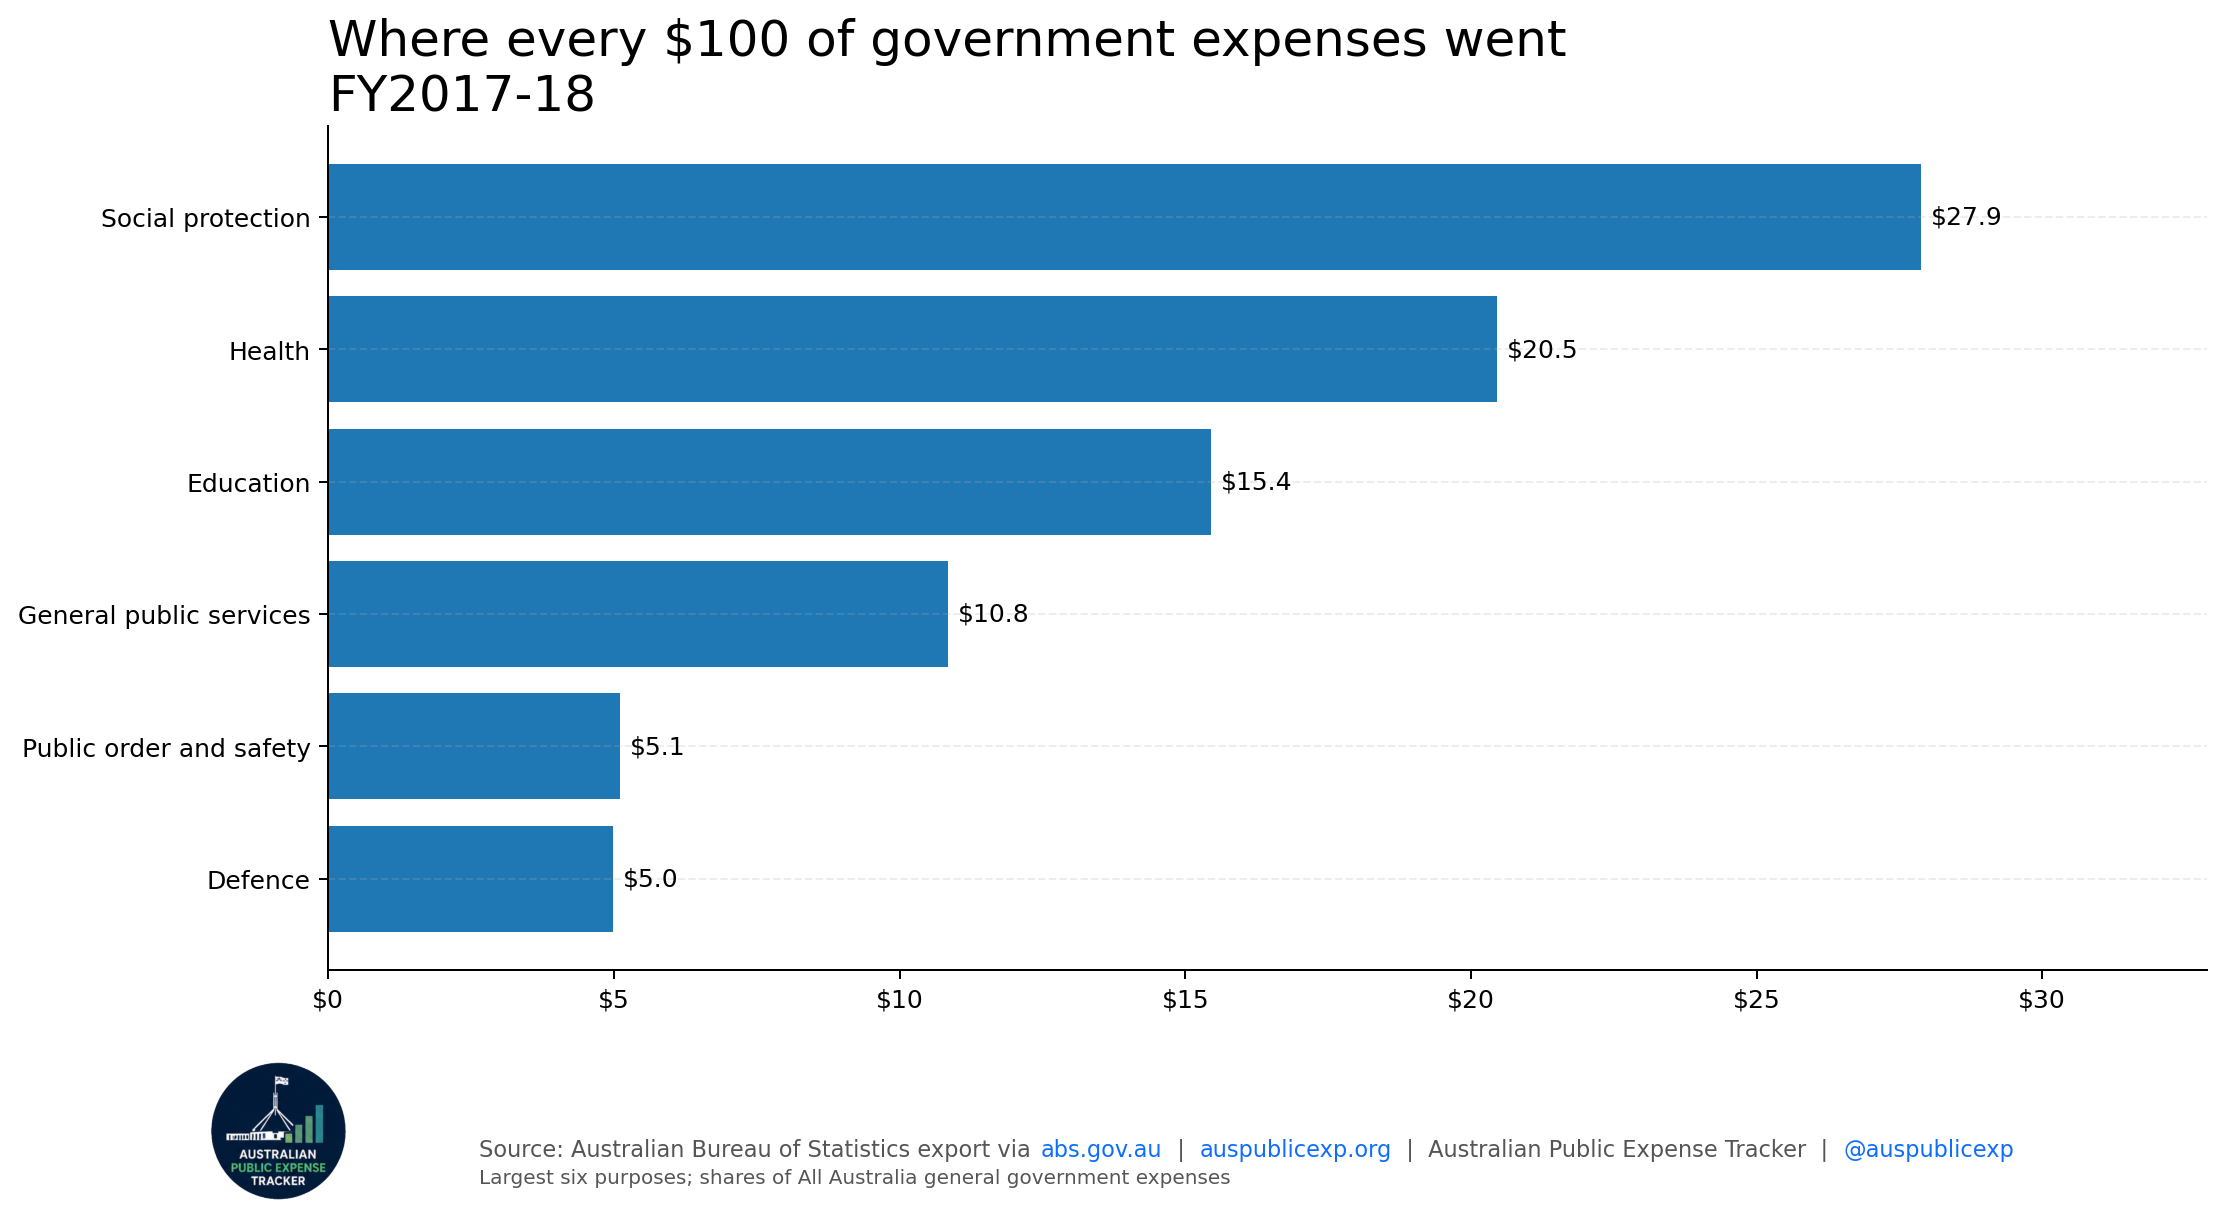
| purpose | dollars per 100 |
|---|---|
| Social protection | $27.9 |
| Health | $20.5 |
| Education | $15.4 |
| General public services | $10.8 |
| Public order and safety | $5.1 |
| Defence | $5.0 |
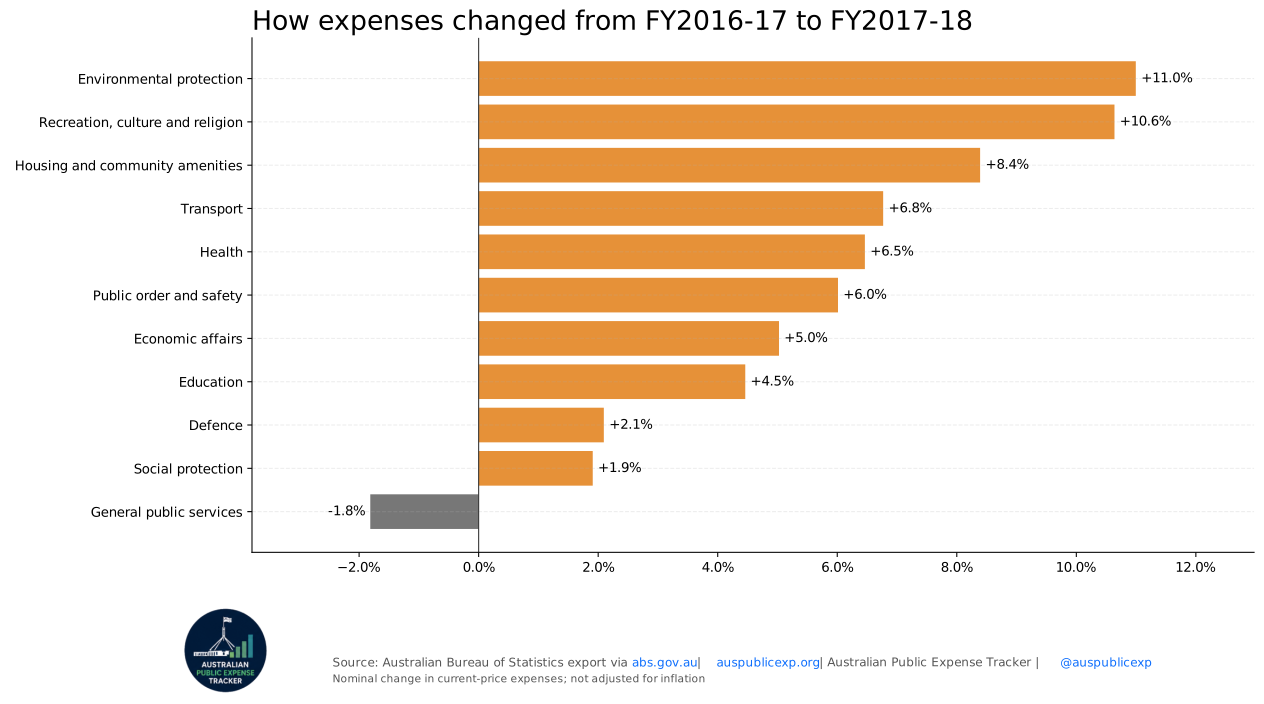
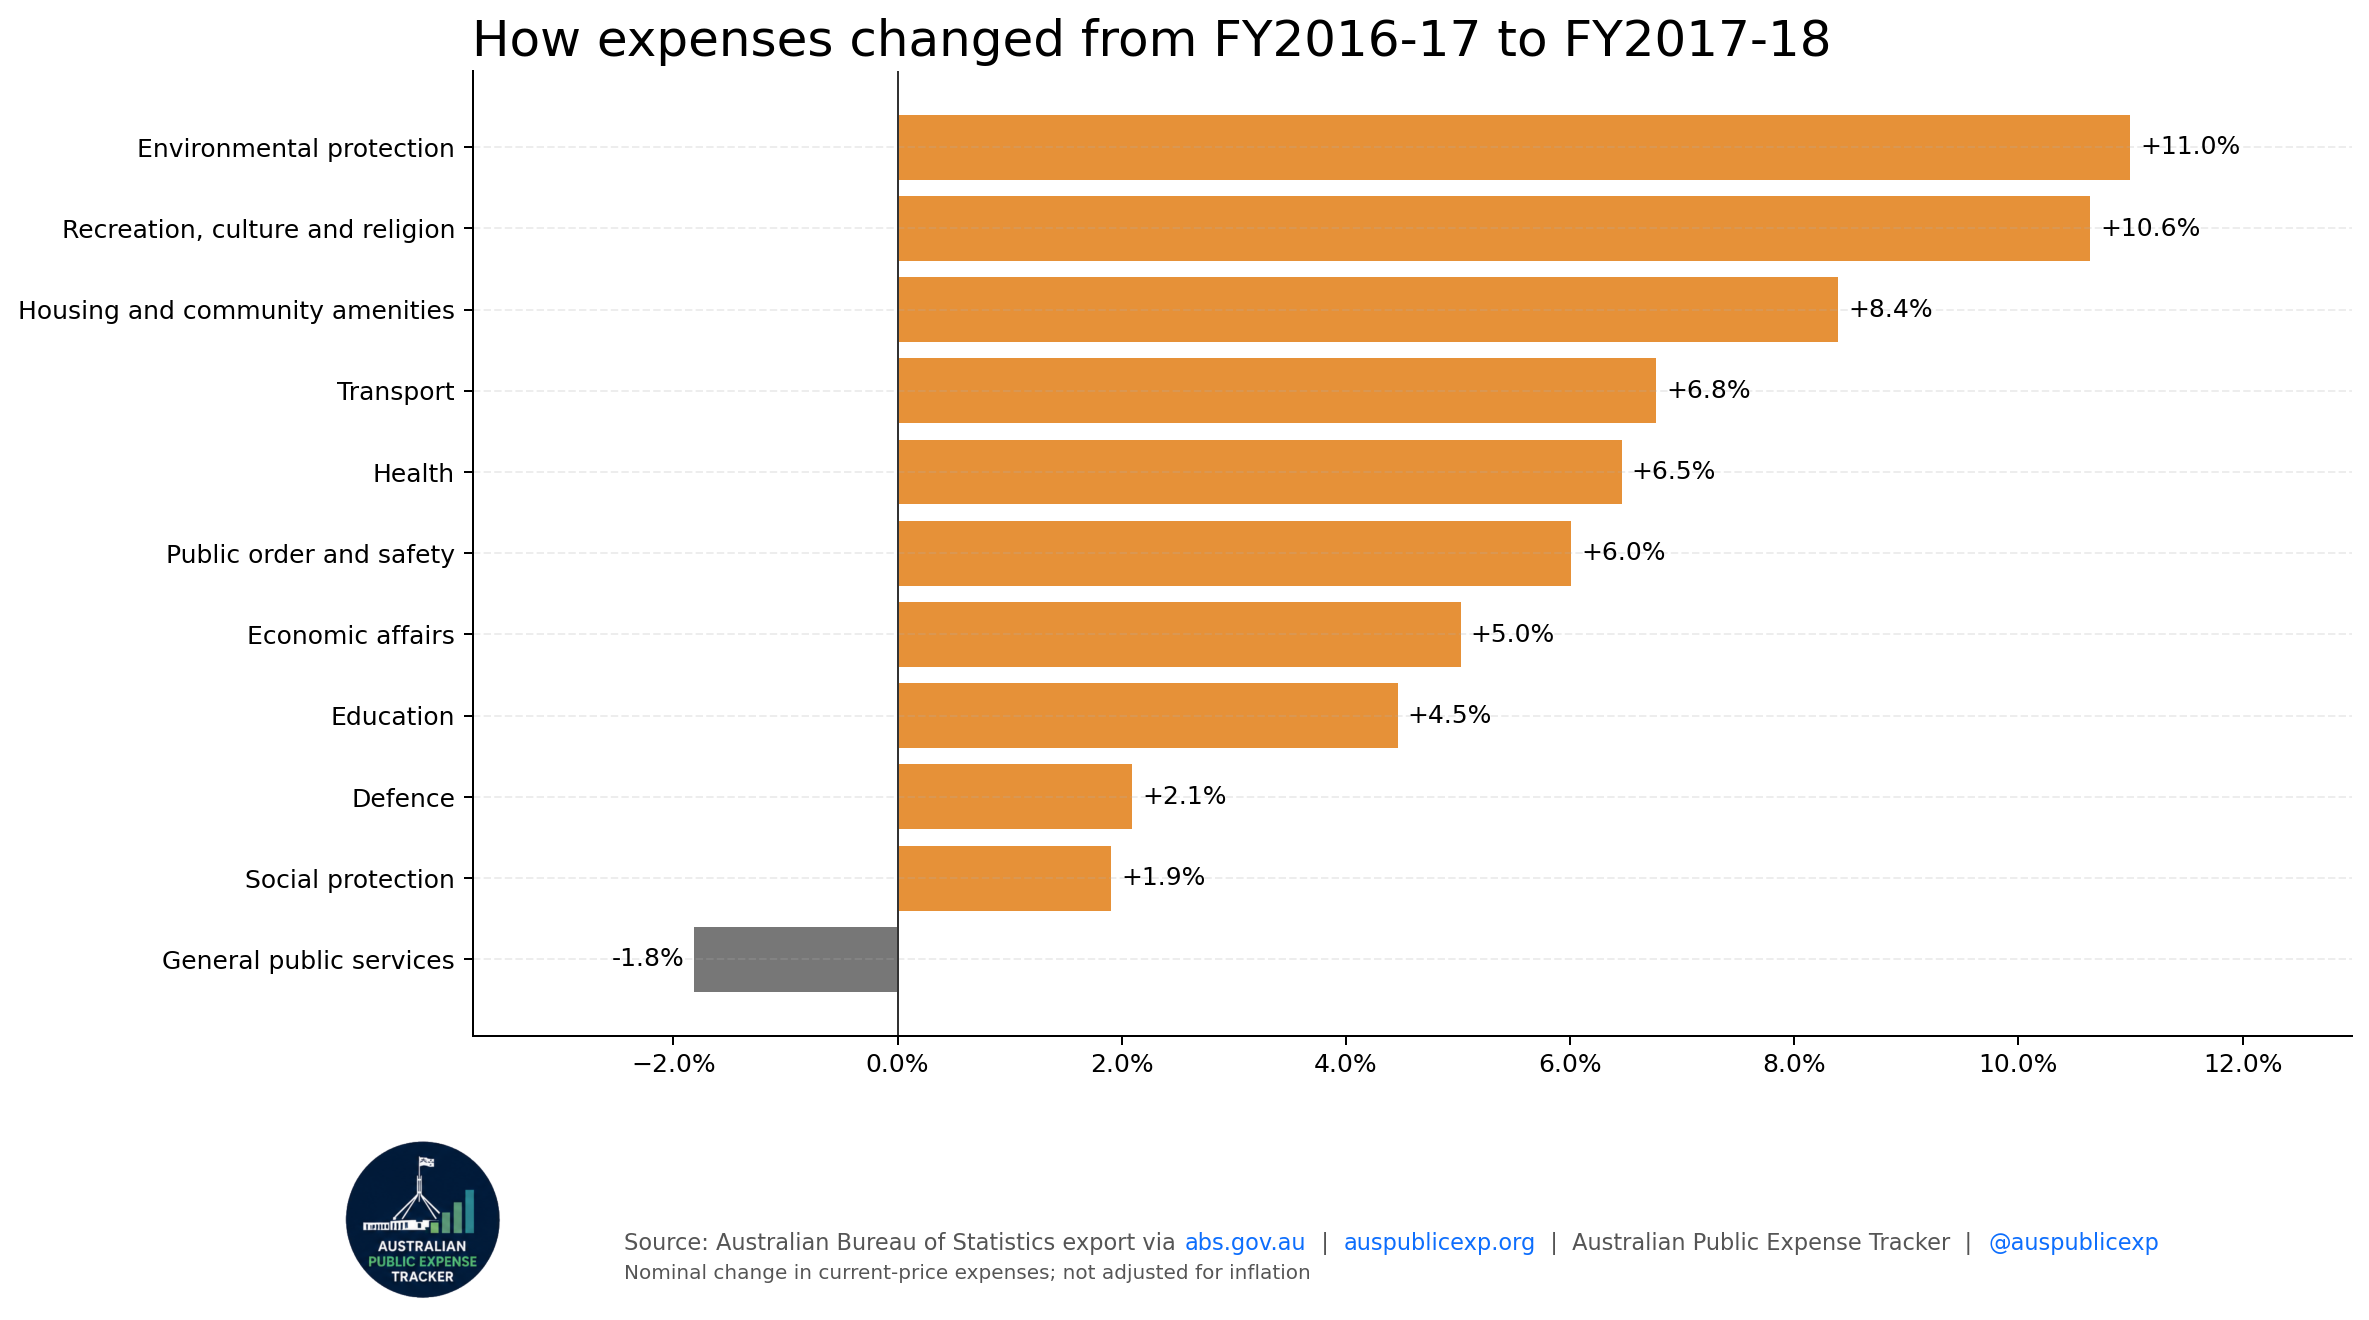
| purpose | nominal change fraction |
|---|---|
| General public services | -1.8% |
| Social protection | 1.9% |
| Defence | 2.1% |
| Education | 4.5% |
| Economic affairs | 5.0% |
| Public order and safety | 6.0% |
| Health | 6.5% |
| Transport | 6.8% |
| Housing and community amenities | 8.4% |
| Recreation, culture and religion | 10.6% |
| Environmental protection | 11.0% |
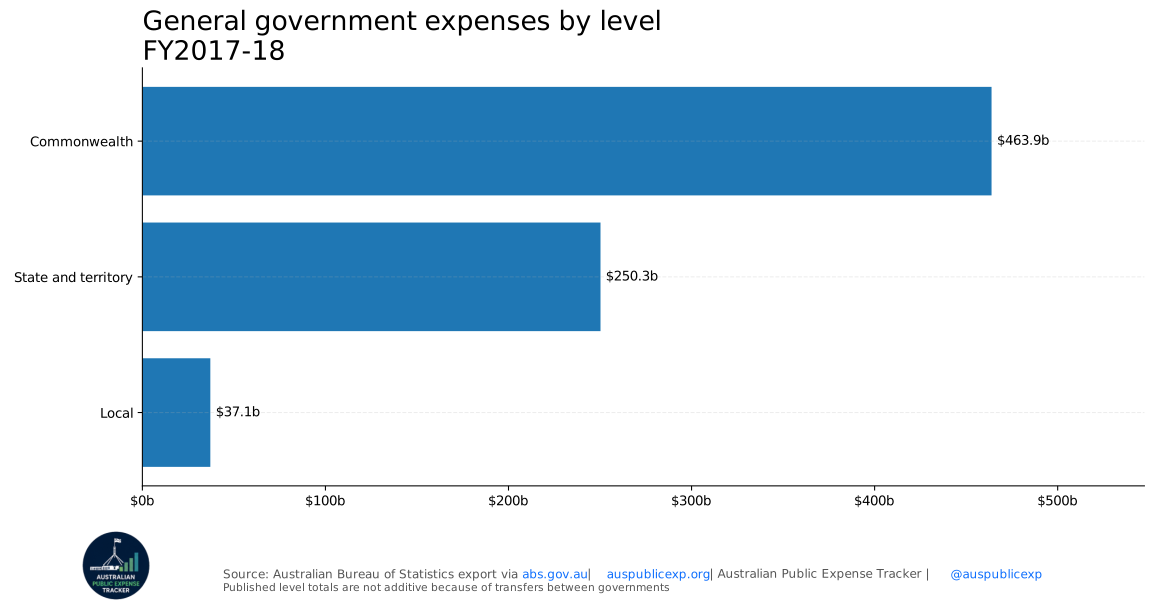
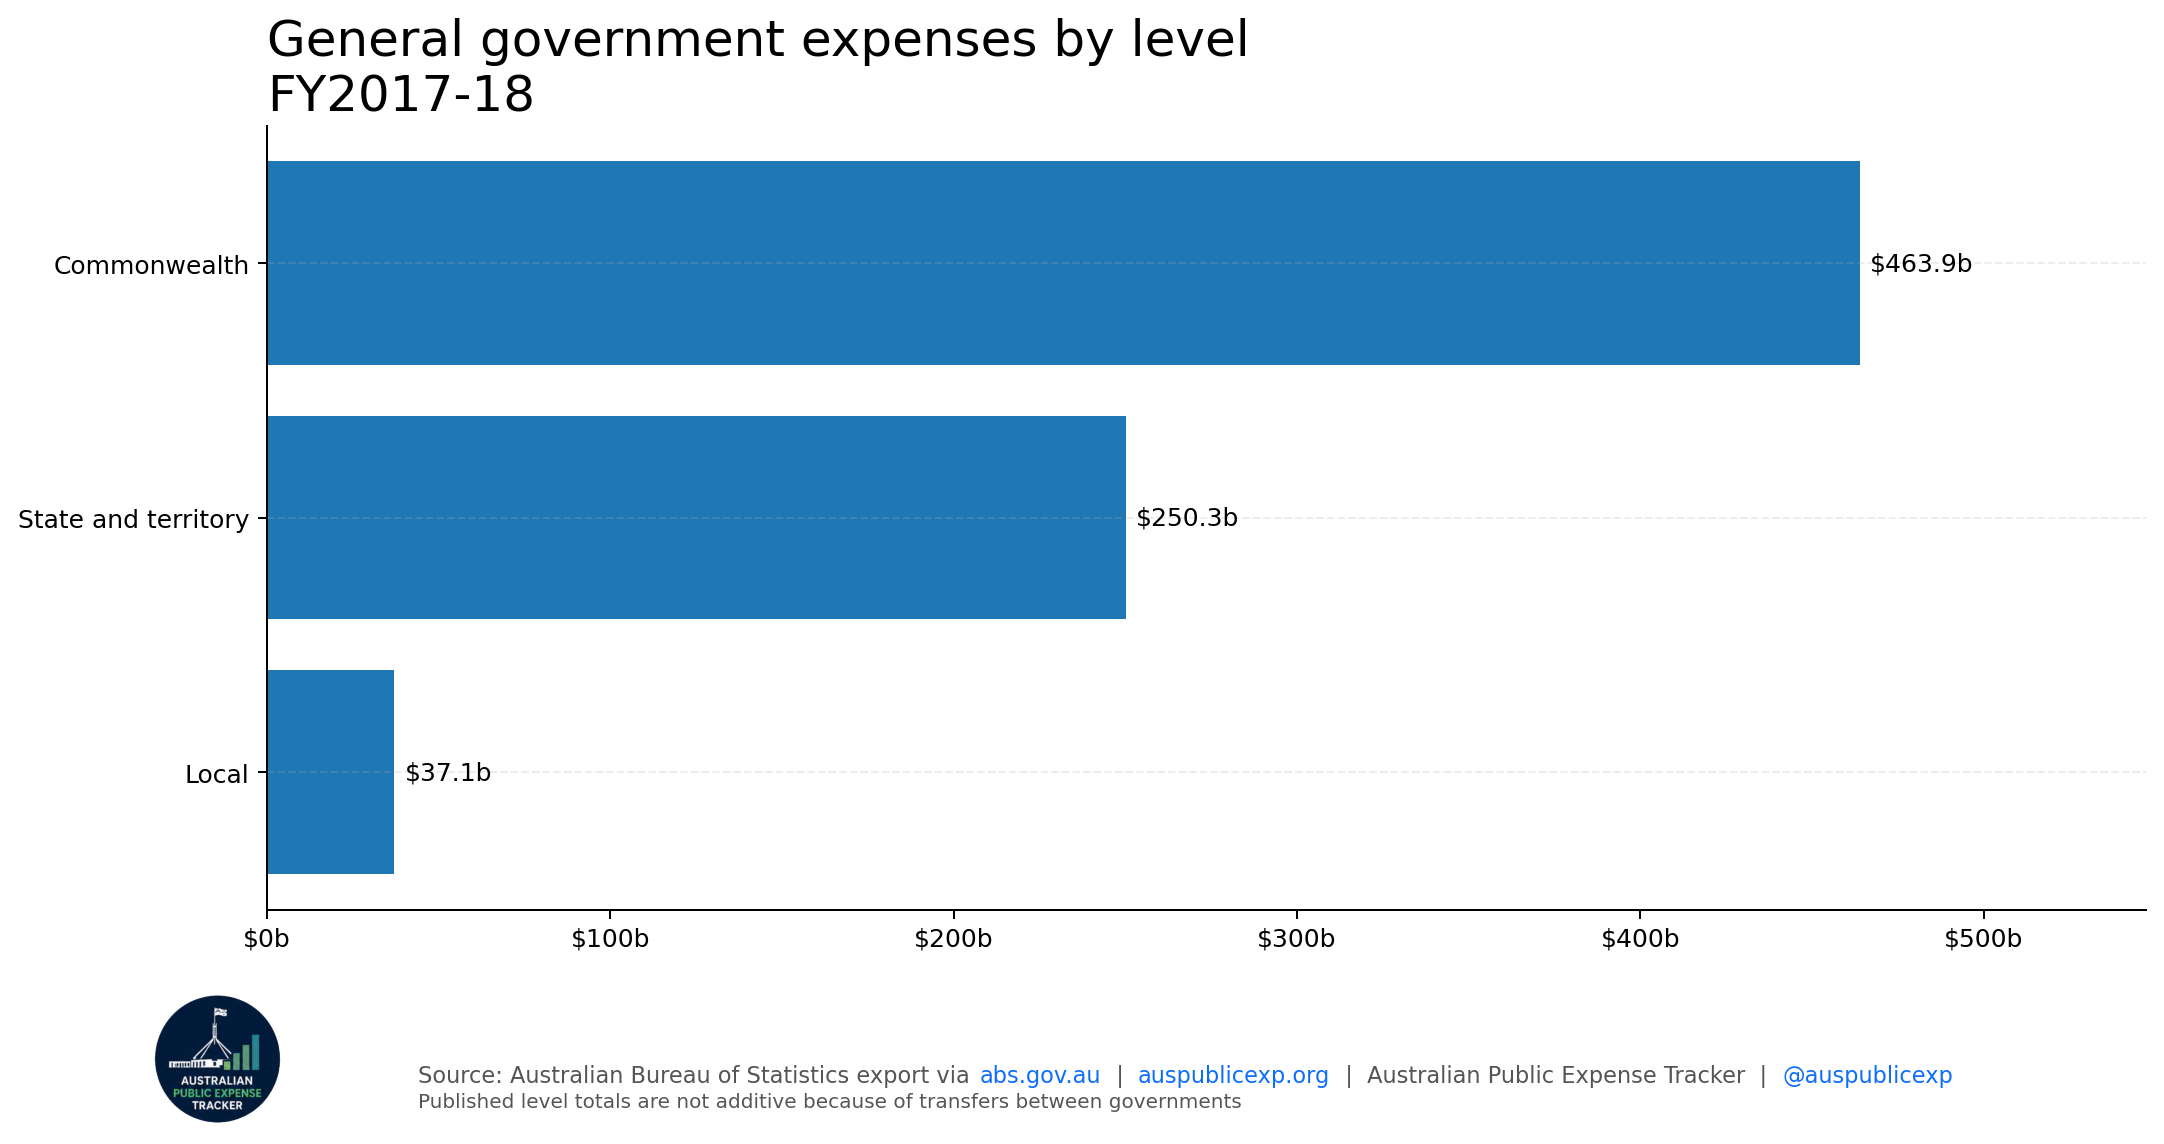
| government level | value millions |
|---|---|
| Commonwealth | $463,877m |
| State and territory | $250,260m |
| Local | $37,119m |