July 2015 to June 2016
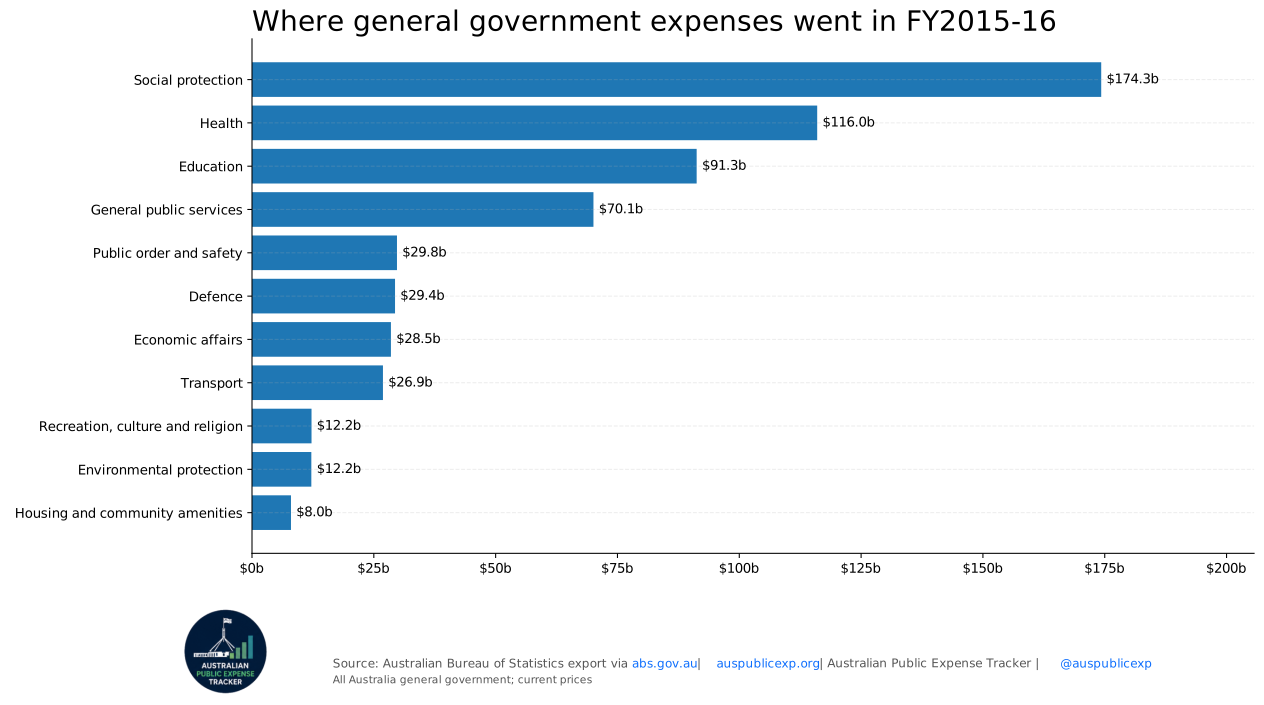
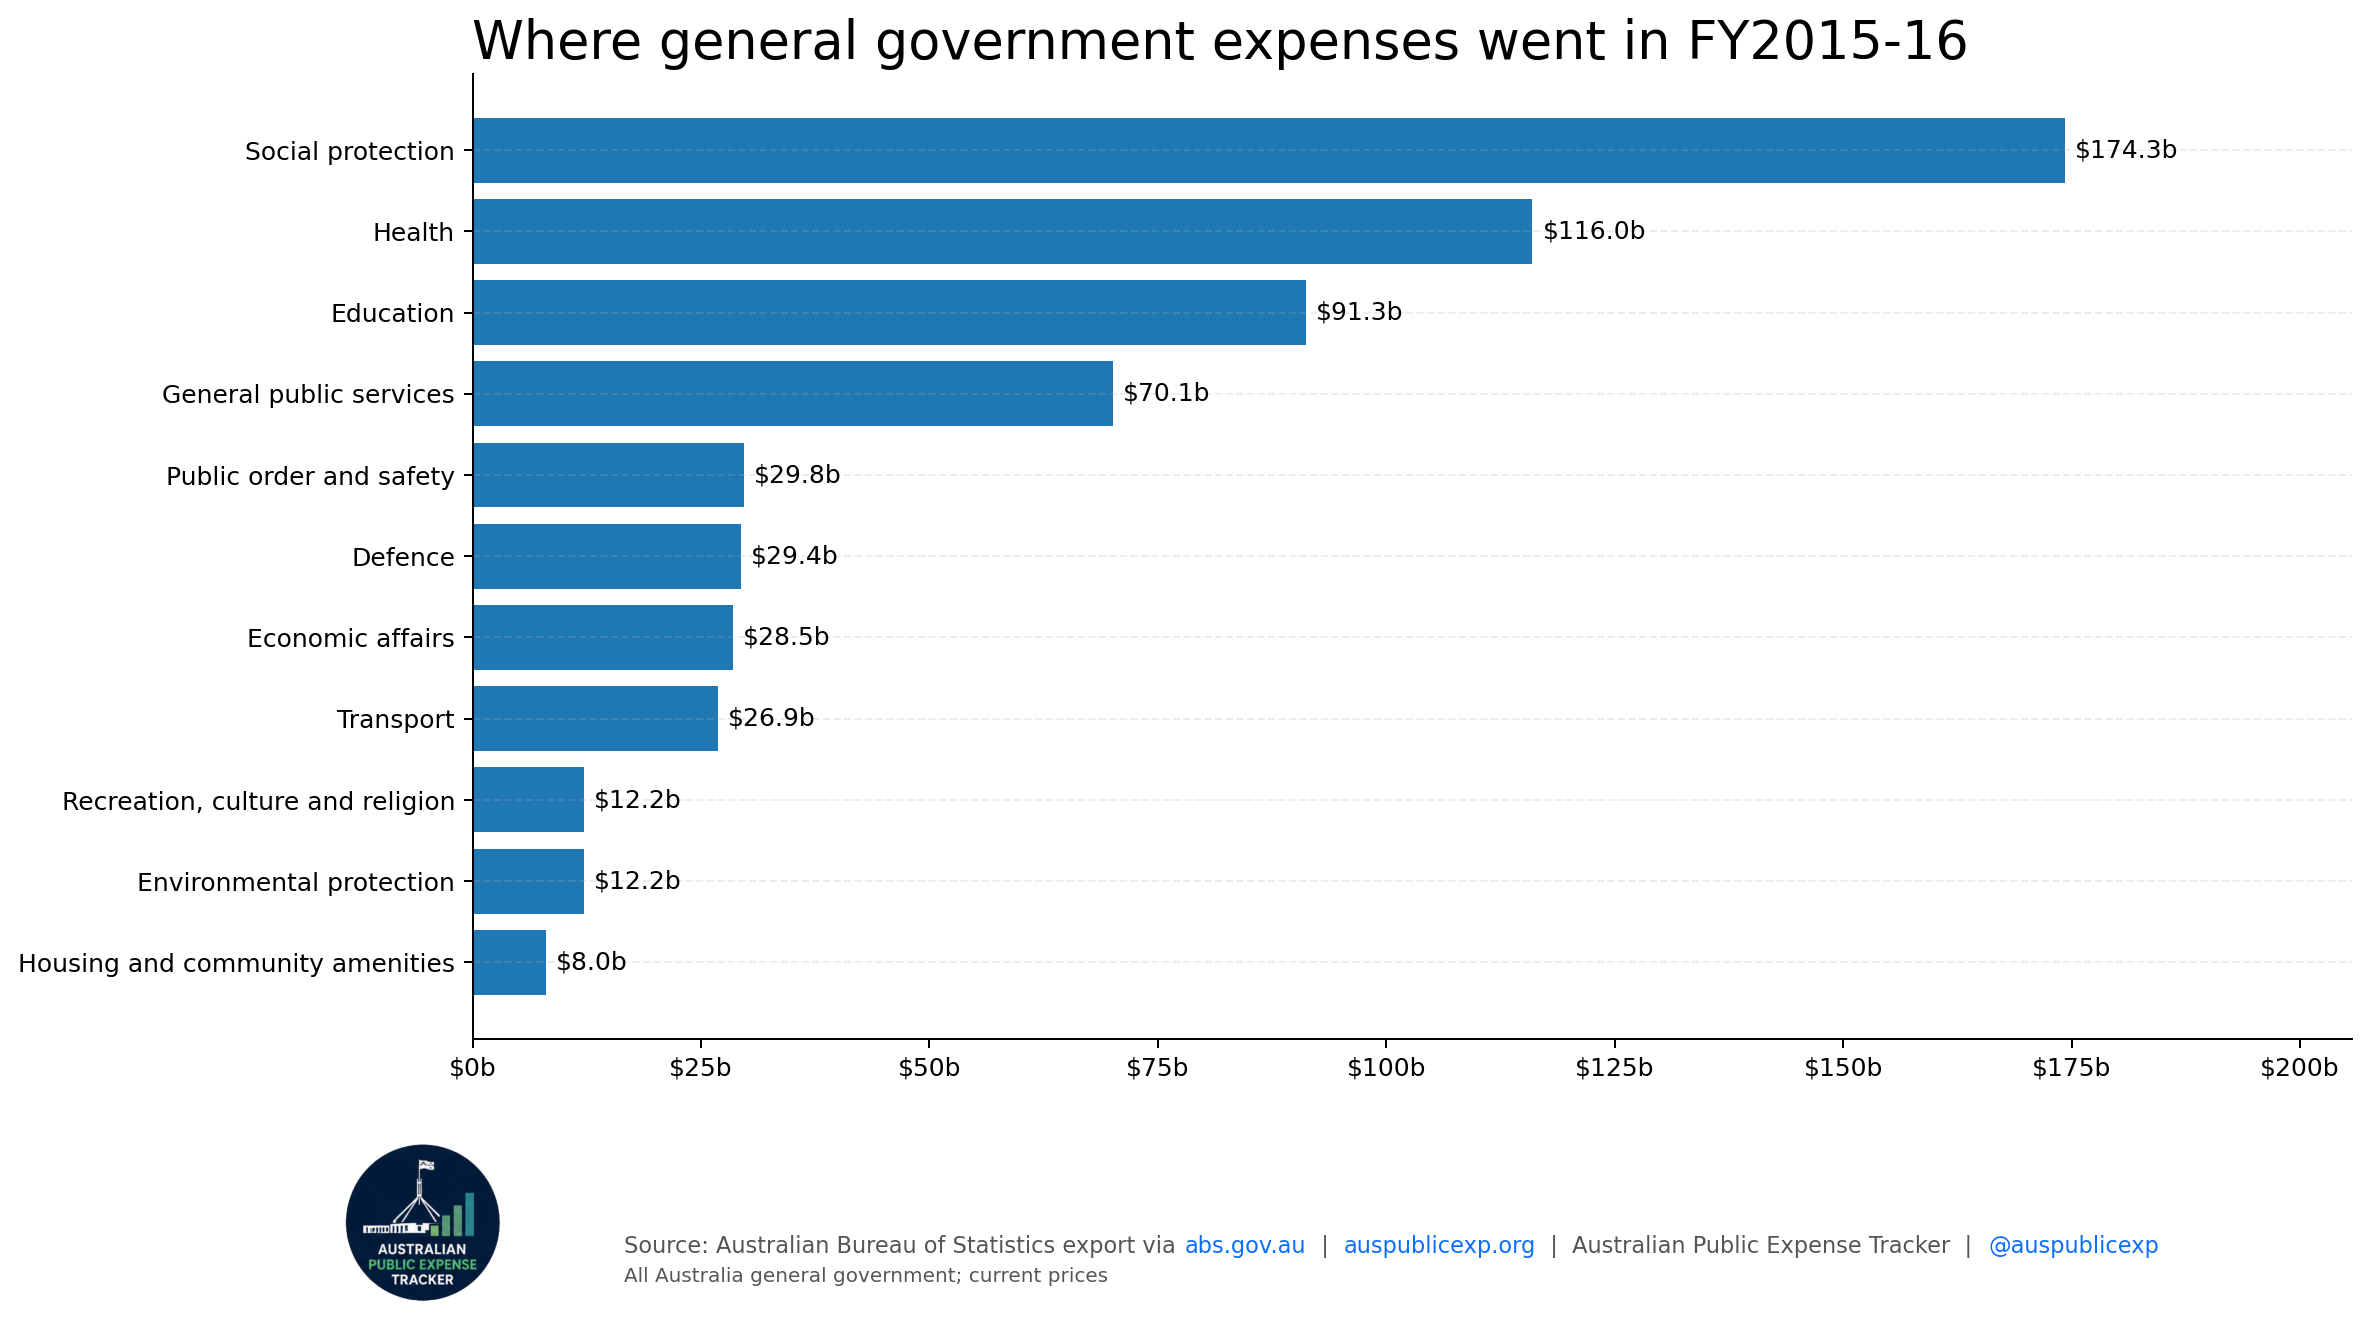
| purpose | value millions |
|---|---|
| Social protection | $174,277m |
| Health | $115,990m |
| Education | $91,253m |
| General public services | $70,072m |
| Public order and safety | $29,752m |
| Defence | $29,353m |
| Economic affairs | $28,510m |
| Transport | $26,873m |
| Recreation, culture and religion | $12,215m |
| Environmental protection | $12,177m |
| Housing and community amenities | $7,999m |
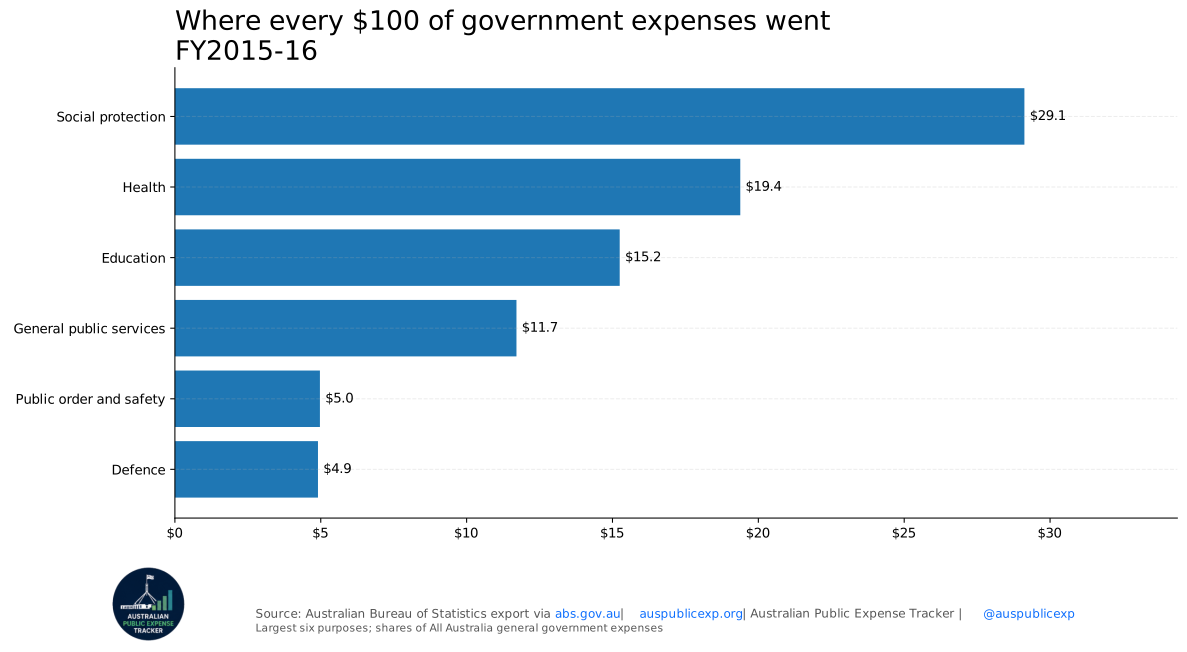
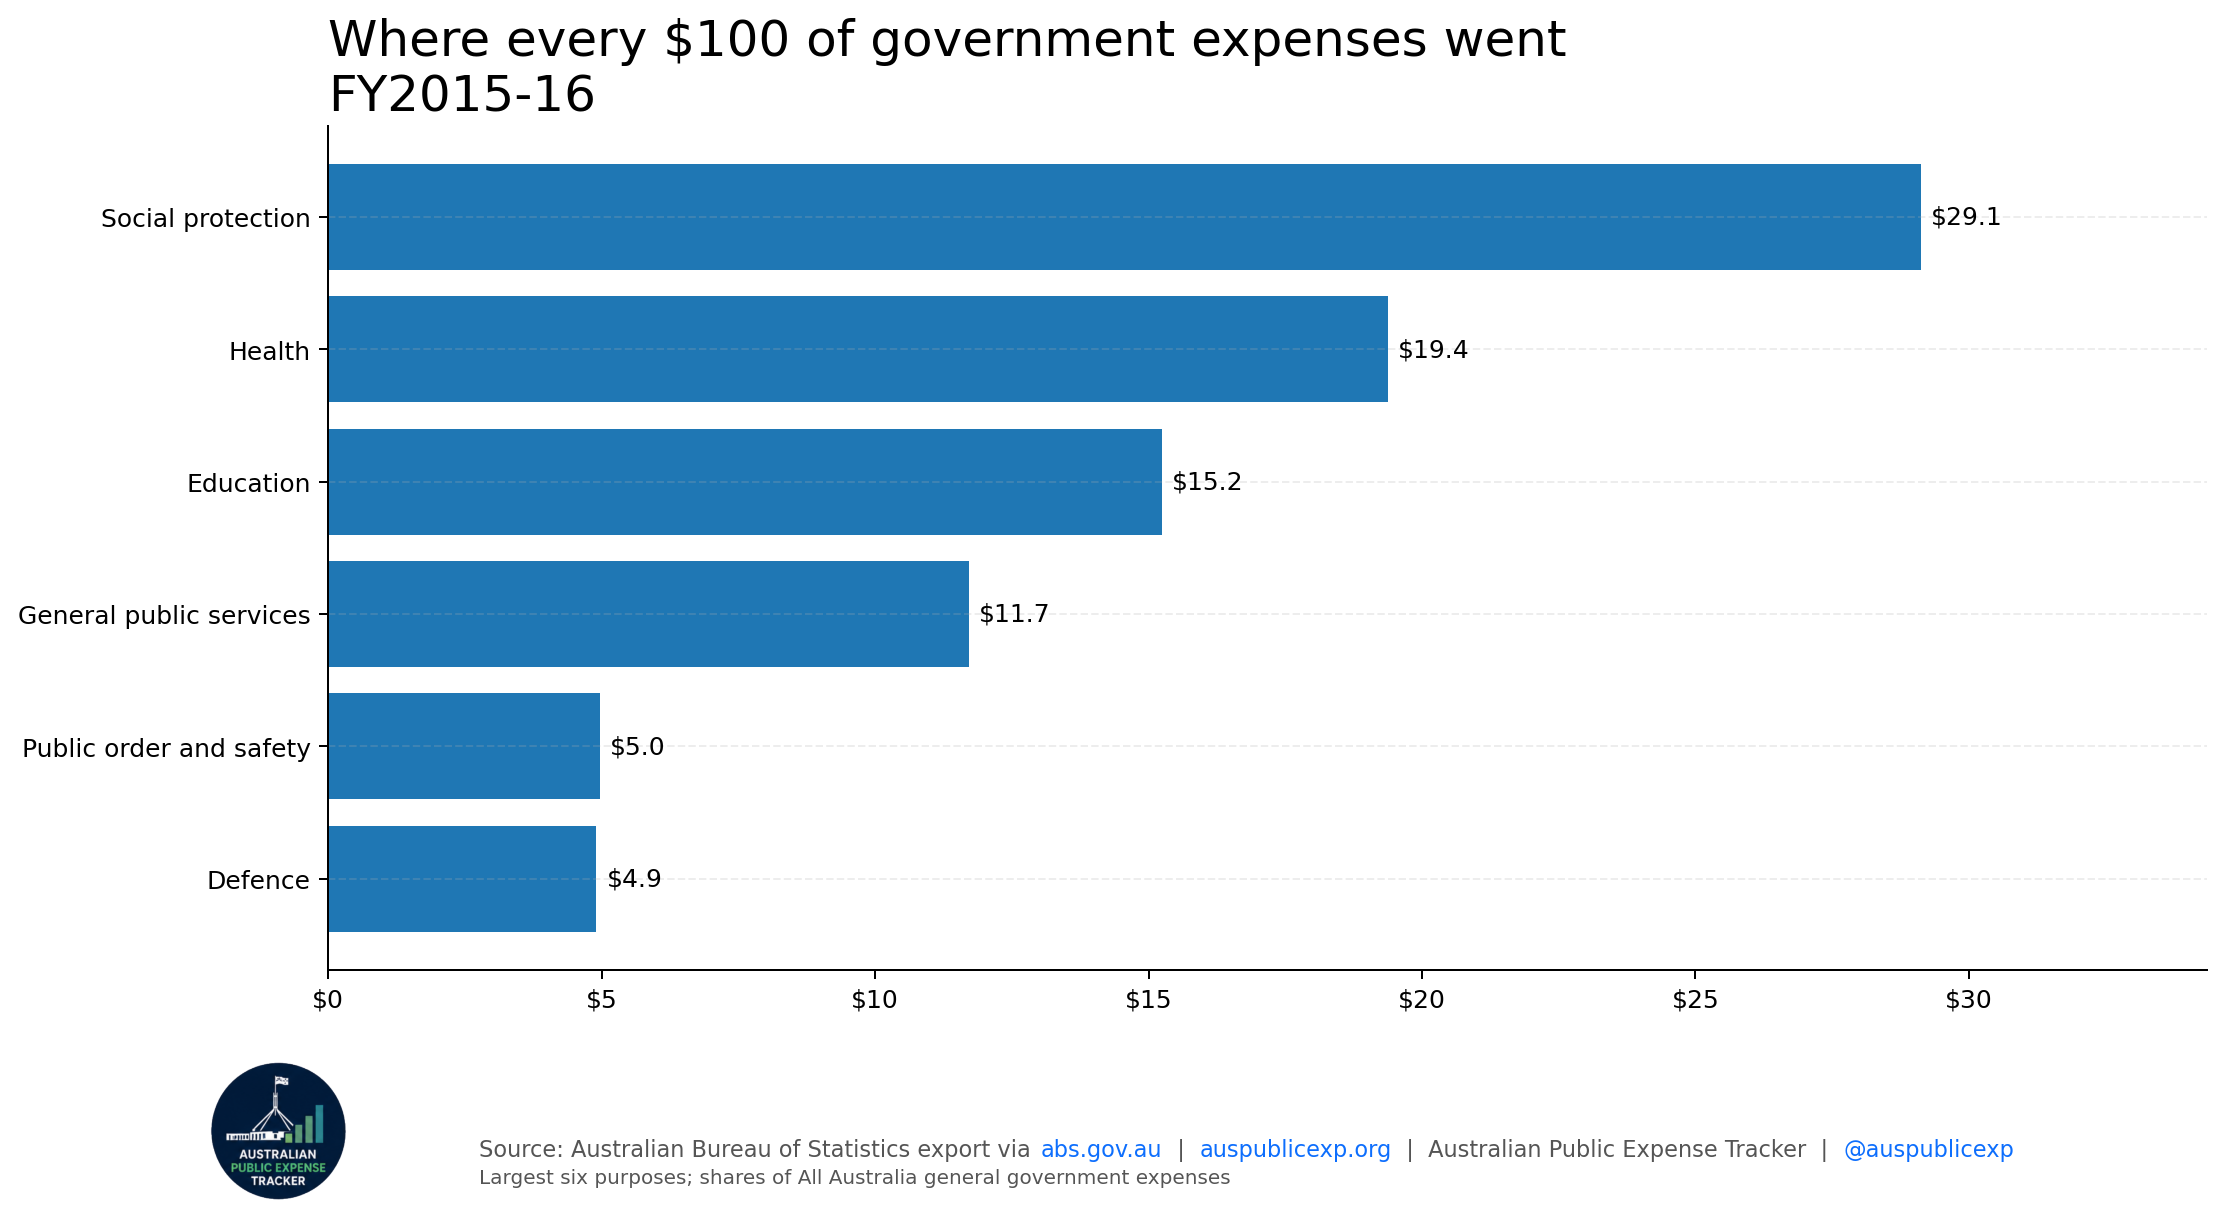
| purpose | dollars per 100 |
|---|---|
| Social protection | $29.1 |
| Health | $19.4 |
| Education | $15.2 |
| General public services | $11.7 |
| Public order and safety | $5.0 |
| Defence | $4.9 |
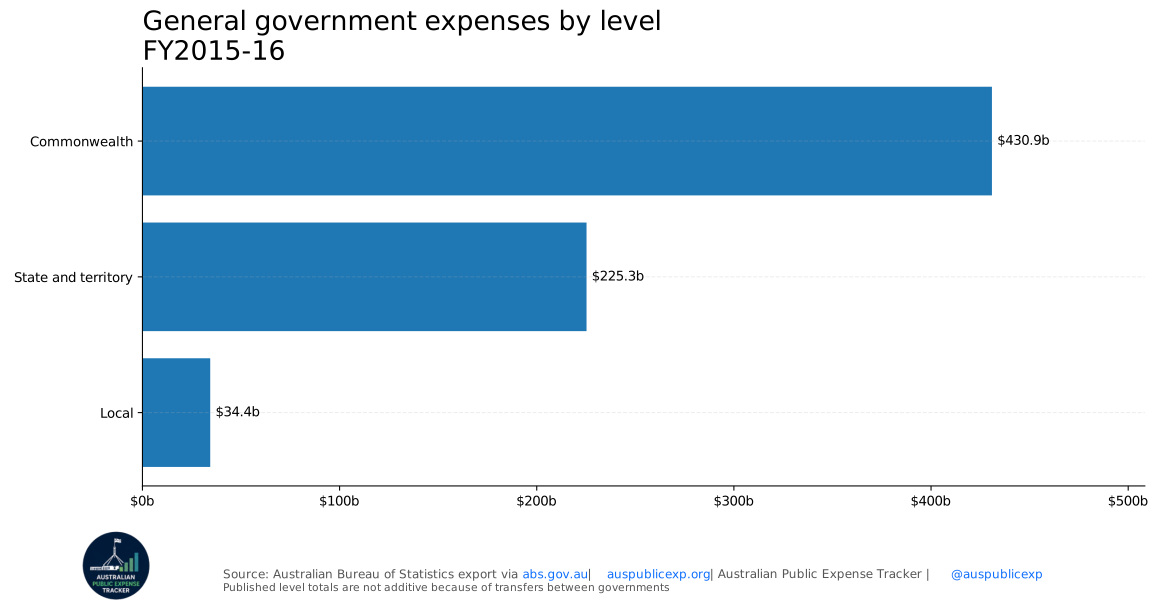
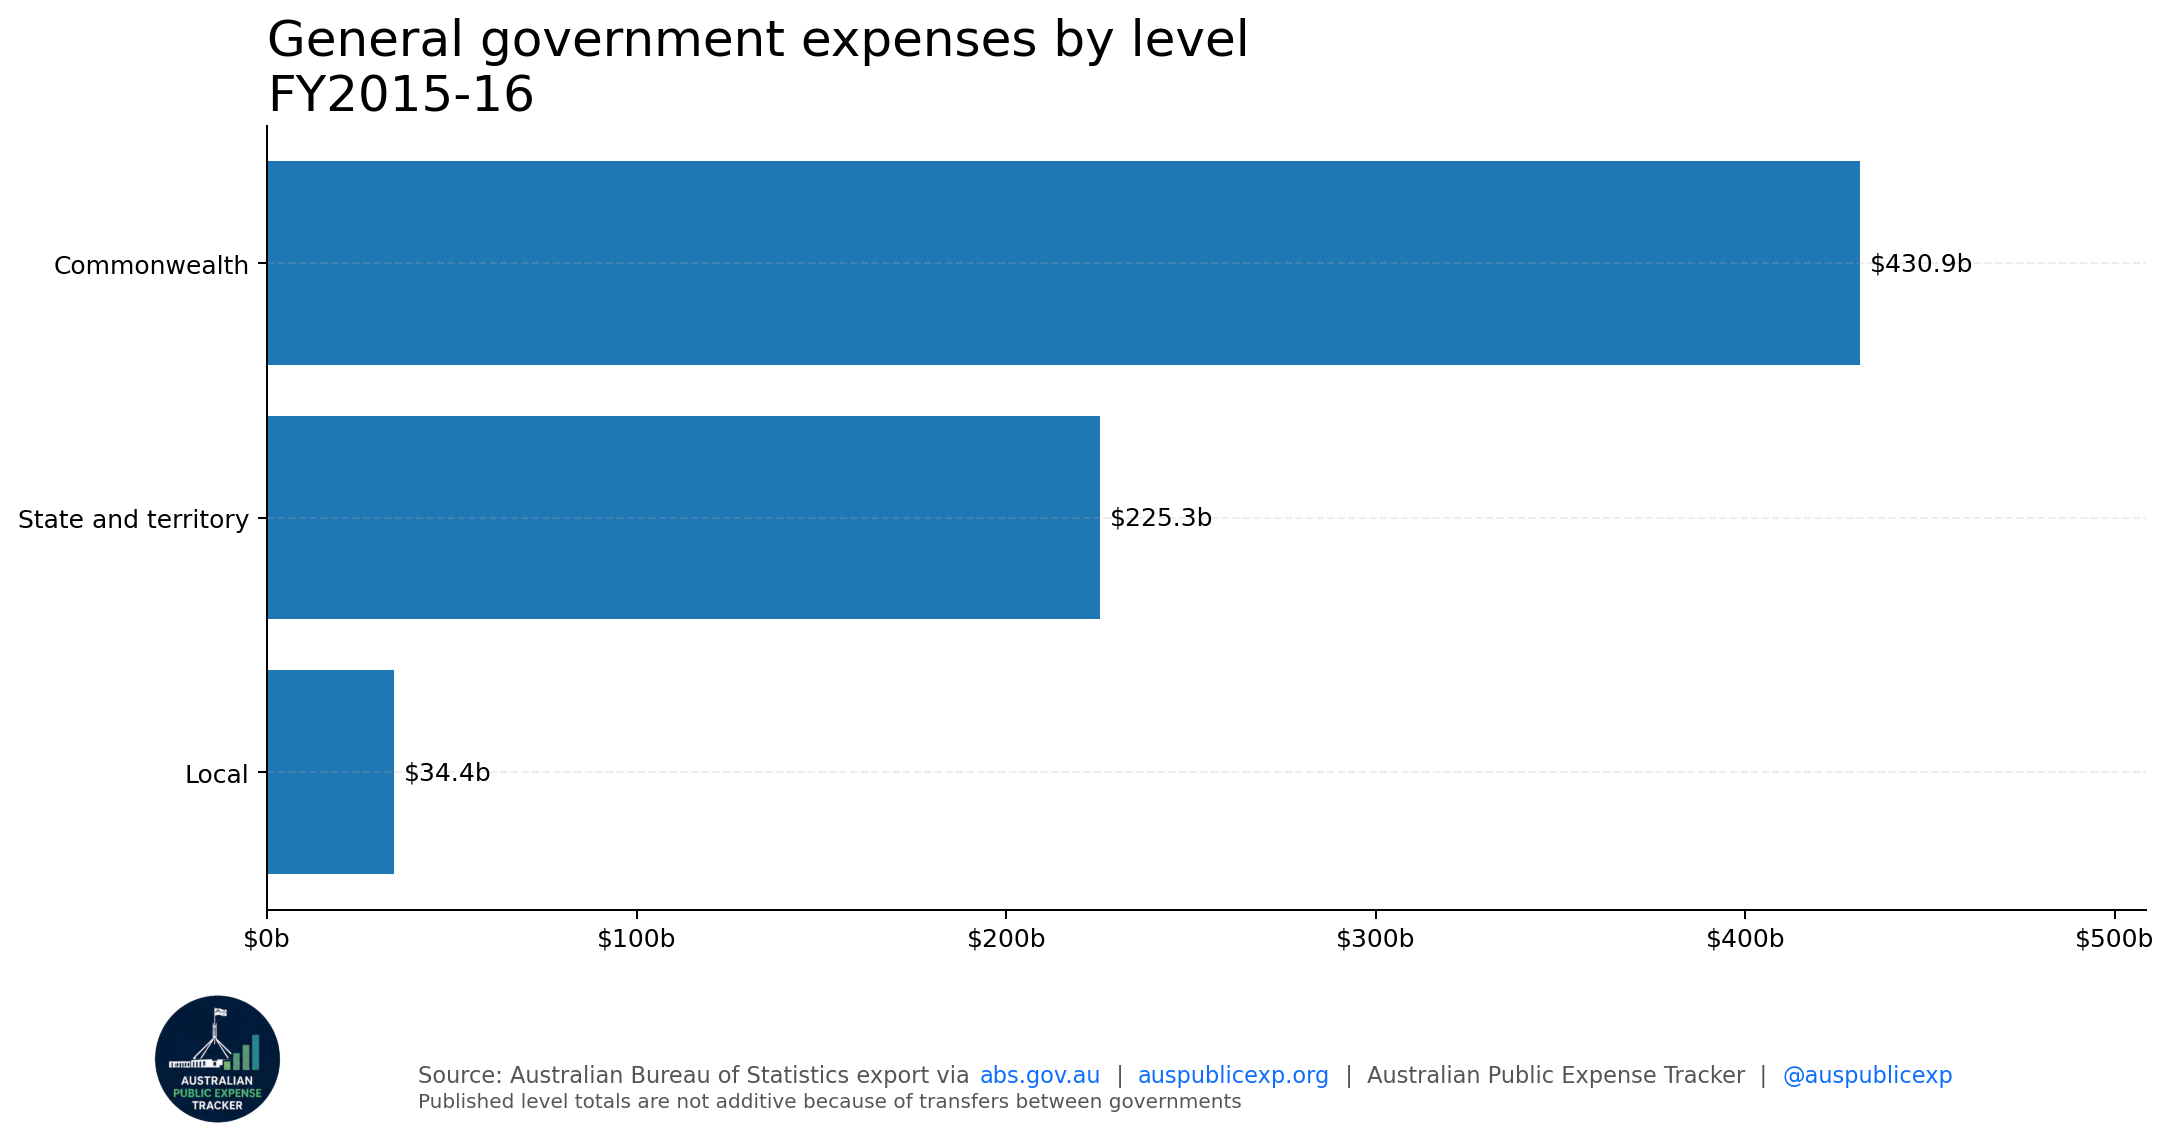
| government level | value millions |
|---|---|
| Commonwealth | $430,889m |
| State and territory | $225,259m |
| Local | $34,385m |